https://www.coastal.ca.gov/kingtides/participate.html#tidemap
Sorry, no records were found. Please adjust your search criteria and try again.
Sorry, unable to load the Maps API.
El Granada, California 94063
The first King Tides of the season are November 15, 16 and 17 and and December 13-15, 2024.
Sign up to receive email about King Tides
Use your smart phone or digital camera to participate in the Project by taking and uploading photos of king tides through the King Tides Photo Upload form. Start by choosing where you’ll go to take your photos and then look at the tide map below to find out what time and how high your king tides will be. Take your photos as near to high tide time as you can.
Your photos will be displayed on an interactive map. (If you’d like to share a video clip of king tides with us, you can upload it here.
Email [email protected] if you have questions.)
* LEARN HOW TO UPLOAD YOUR KING TIDES PHOTOS *
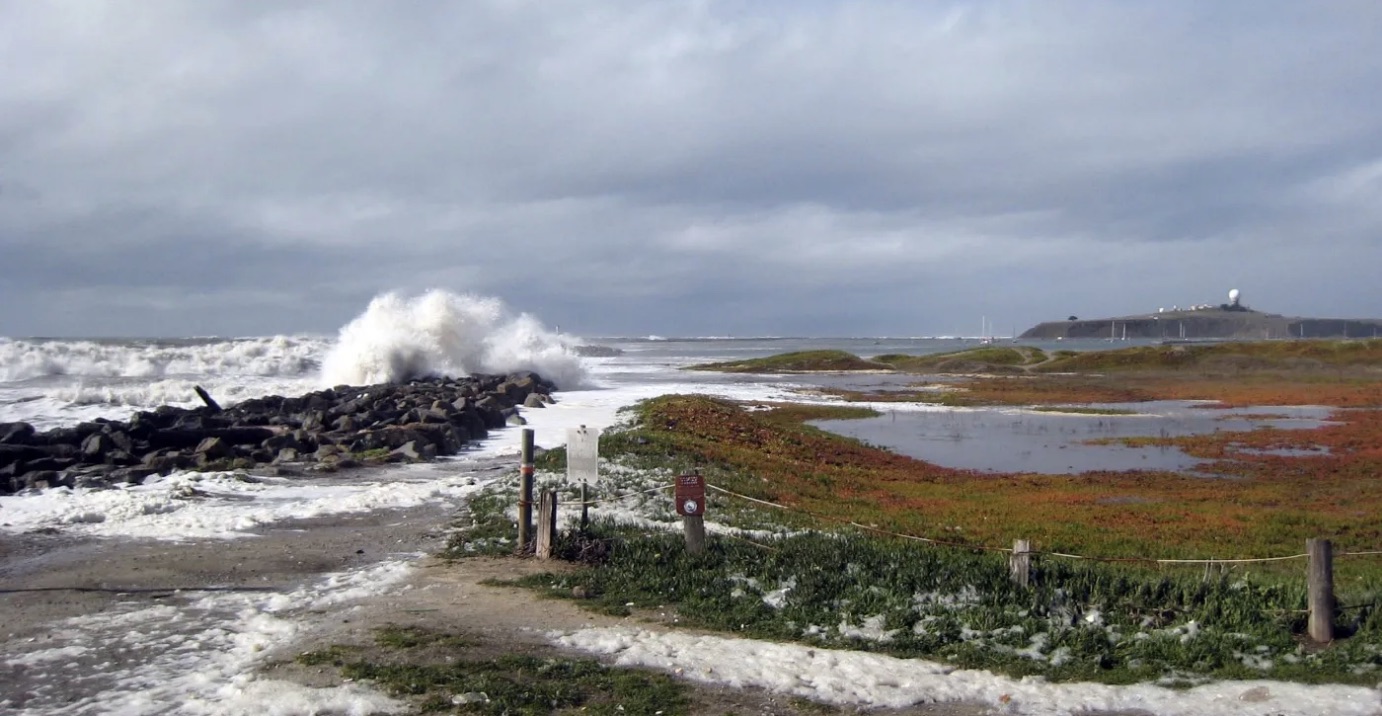
Some of the most powerful images are taken in areas that are subject to flooding and erosion, and of places where high water levels can be gauged against familiar landmarks (such as cliffs, rocks, roads, buildings, bridge supports, sea walls, staircases, and piers).
In addition to uploading your photos, you can also share them on social media using #kingtides. We’ll be liking and sharing your posts throughout the King Tides season.
The public can help them California King Tides Project photograph the highest predicted high tides of the year to increase our understanding of what’s vulnerable to flooding today, plan for future sea level rise, and get us all talking and thinking about the impacts of the climate crisis and what we can do to make a difference. Choose a spot where you can take a photo showing the height of the water in relation to a stationary landmark such as a cliff, bridge, sea wall, or pier. You can also photograph high tide flooding on roads or in wetlands. You can upload photos either via a web browser or with the free Survey123 app. Be sure to have your phone’s location services ON when you’re taking your King Tides photos! If using a digital camera, please make a note of exactly where you are so you can mark your photo location on the map when you upload it via the web browser. Please email [email protected] if you have trouble uploading your photos.
To Participate:
Choose where along the Coast, Bay, or Delta you’d like to go. Visit within a half hour of high tide time on November 15, 16, or 17 and December 13-15, 2024.
Pillar Point Harbor
- Nov. 15, 2024. high tide time / height: 9:06 AM / 6.92 ft.
- Nov. 16, 2024. high tide time / height: 9:45 AM / 6.97 ft.
- Nov. 17, 2024. high tide time / height: 10:27 AM / 6.82 ft.
- Dec. 13, 2024. high tide time / height: 7:58 AM / 6.91 ft.
- Dec. 14, 2024. high tide time / height: 8:42 AM / 7.04 ft.
- Dec. 15, 2024. high tide time / height: 9:26 AM / 7.01 ft.
- Be Safe. Don’t turn your back on the ocean, and don’t drive through flooded roads. Watch out for shorebirds that may be further upland than usual. The most important thing to remember is to be safe! Take extra precautions when you walk on slippery areas or near big waves, and always be conscious of your surroundings and the weather conditions. Don’t turn your back on the ocean! Please be aware that shore birds may be taking refuge in areas above the tide line – don’t flush them out in the process of getting your shot.
- Make sure you have Location Services turned on for your camera app, or take careful note of where you’re standing.
- Upload your photos using our online form. You can photograph King Tides on your own, or you can join one of the community events taking place up and down the coast. Explore past King Tides photos and learn more about the Project on the California King Tides Project website.
Tide Map Choose where you want to photograph and then find the nearest pin on on the map below. That will tell you what time high tide will be, and you should take your photo as near to that time as you can, ideally within a half hour. (We’re looking for photos in any tidally-influenced location; you aren’t limited to the locations pinned on this map.) If you have trouble viewing the map on this webpage, open it in a separate window. You can also check NOAA’s Tides & Currents webpage directly to find additional tide information.
Depending on location, some of the King Tide dates may be significantly higher than others. Some parts of inner San Francisco Bay/Delta may have their highest tides on different days, as noted on the map. Try to take your photographs on the day of your location’s highest tide, if you’re able. Storm swells may increase water height, so it’s helpful to check swell forecasts. Focusing on our designated King Tides dates allows us to create a “snapshot” of the whole coast on the highest predicted water levels of the year.
________________________________________________________________________


