|
Getting your Trinity Audio player ready...
|
OWN VOICE, OWN WORDS. ~ Gregg Dieguez, Montara resident.
My Lab is happy about SMC’s forthcoming easing of recreational restrictions, even though people still aren’t petting him. However, California as a whole is still heavily restricted. But California is among the best states in handling this, right? And the Bay Area was ahead of the curve, right? So why are WE still shut down? Let’s divide this week’s article into 4 topical sections:
1. How IS California doing compared to the rest of the country?
2. IS California ready to open now?
3. What statistics can you BELIEVE about COVID-19?
4. So what? What do we do when, and how?
1. How IS California doing compared to the rest of the country?
No doubt you’ve heard about how CV-19 statistics and testing are flawed and thus prevent rigorous fact-finding at this point. However, we can still use existing measurements in two ways:
A) to spot TRENDS, and
B) to evaluate RELATIVE ‘performance’ among the states.
The East Coast got hit hard, was a little slow to act, and may have gotten a more virulent strain of the virus. For now, let’s exclude those Northeastern states from comparisons, because they’re obviously far worse than others. In the West, Washington and California got hit first in the nation with travel from China. Those two states have done some containment, though daily deaths are still rising in Calif. Note that Deaths are a LAGGING indicator; the disease (measured by # cases) is already out there, and the deaths will eventually follow. If you want to know where you are right now, you can’t rely on deaths caused by cases weeks ago. And you have to adjust for population to compare states, so cases and deaths per million are the best comparative data we have. And since deaths will lag cases, Cases Per Million seems the single best estimate of the current situation.
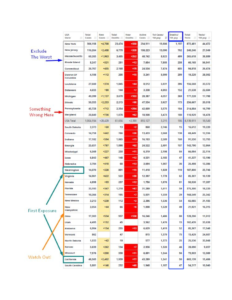
So, how to evaluate states for CV-19 risk? Other states should all LAG the East and West Coast in both cases and fatalities, because the virus didn’t start there. If states are ALREADY WORSE than Washington and Calif., then you have to flag them as Mis-Managed.
In that context, here’s where the states stand, sorted in descending cases per million population. >> CLICK TO ENLARGE >>
I’m not “excusing” the Northeastern states. It’s clear there was mismanagement by DeBlasio, if not Cuomo, in NY. And there must be stories in those other states as well. But, if your state was outside the immediate wave of travel infections on both coasts, you had time to see this coming, and act. Things are going to get worse in all the “late arrival” states as the disease blossoms. Thus, if you’re ALREADY WORSE than Washington state, then you clearly did something wrong. And if you are ALREADY WORSE than California, then you’re clearly under-performing, and again, going to get worse. What is clear from this chart is that Georgia is one of the riskiest states to be re-opening, and Florida is on the way.
So, California is doing better than most, in spite of several disadvantages, but….
2. IS California ready to open now?
Most Bay Area counties do NOT have a “Downward trajectory of documented cases within a 14-day period” which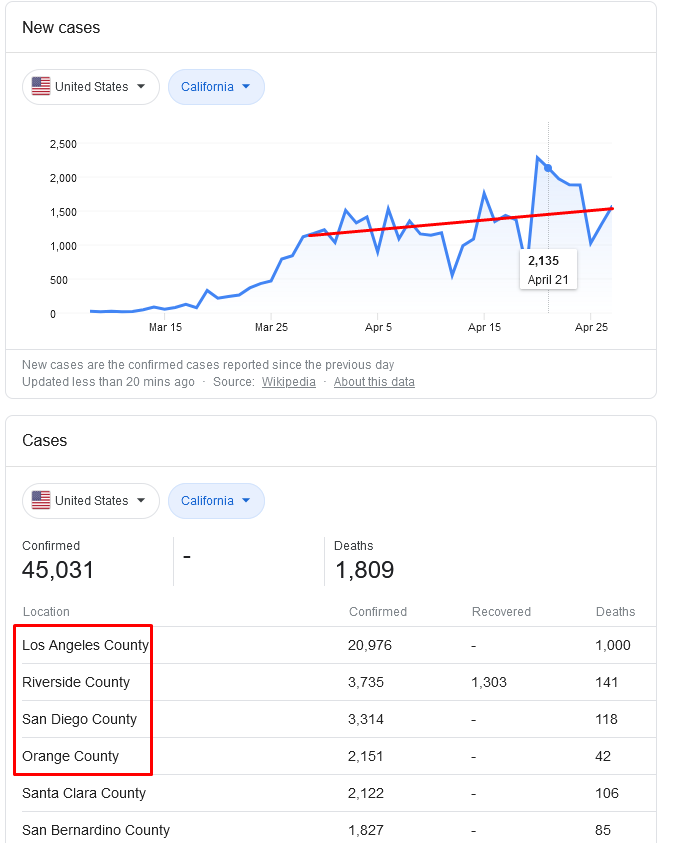 was the CDC guidance published last week. In fact, most counties don’t seem to be reporting Recoveries at all. However, we were feeling pretty good about ourselves in the Bay Area, getting an early jump and all. But if you look at the Bay Area county websites you won’t find that required declining number of cases. In some counties you won’t find ANY time series data on cases, but you can find it HERE by selecting the counties of interest. They’re all going up in case count.
Calif. Statewide numbers are even worse. Not only is the total case count going up (?because…not logging recoveries?), the DAILY NEW cases are still going up. And as you can see in the red box from the screen shot, it’s Southern California.
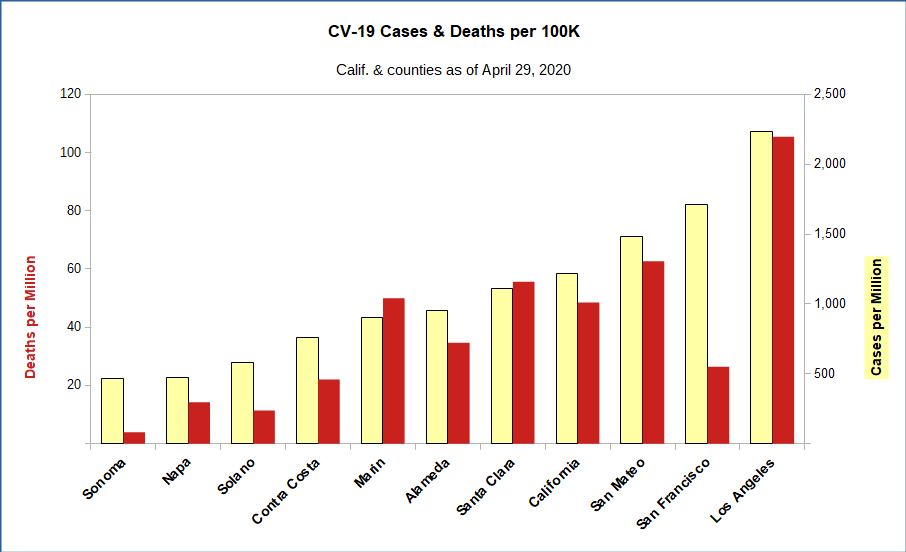
Comparing Bay Area counties with the entire state and LA, shows that even adjusting for population, LA is the problem area. It has more cases because it’s bigger; the trends there are worse; and the frequency of cases and deaths are greater. Note that SF has a similar case frequency to LA, but for some reason, much lower mortality. Calif. has to stay shut down not only because we in the Bay Area haven’t attained DECLINING case loads, but because SoCal is in worse shape. If Los Angeles were a state, it would be 13th worst, little better than South Dakota, worse than Georgia, and critically, WORSE than the state of Washington – which had early exposure. If San Mateo County were a state, it would be noticeably better than Washington, but worse than Nevada and Florida. Not great, in other words.
3. What statistics can you BELIEVE about COVID-19?
Perhaps it’s easier to list the things you CANNOT believe, before assessing the statistics:
1. DEATHS: Deaths are being under-counted and miscounted everywhere. WaPo found 15,000 ‘excess deaths’ in just the past month which were NOT classified as CV-19, but just “happened”.
Given our criminally insufficient testing capabilities and catastrophic slowness in responding, it’s been obvious that the current official number of COVID-19 related deaths is the minimum (i.e. “floor”) possible estimate of U.S. deaths due to this pandemic. And that only includes deaths strictly defined as being due to the virus, not 2nd order deaths due to over-stressed medical systems, etc.
Clearly people with pre-existing conditions were pushed over the edge by the disease, or by the inability to get treatment due to hospital congestion. Further, individual states are counting COVID-19 deaths differently. Alabama is nitpicking between “died *from* COVID” versus “died *with* COVID”, including classifying individuals in that second category even when they have tested positive for COVID and ended up dying from lung related issues. On the other hand, Colorado is being more conservative in its numbers and is including “probable” COVID-19 deaths in their counts for cases where there is no test to confirm diagnosis, but the profile of symptoms and cause of death strongly resembles what we expect. Further messing with the accuracy of our current understanding of the disease progression are the up to *3-week* lags in getting these deaths statistics from some states. We aren’t even sure yet if the April 4 deaths in the WaPo analysis are high enough.
2. NUMBER OF CASES: Early estimates were that half the infections were not being reported because of mild symptoms people ignored, until that now-debunked Stanford/Santa Clara study talked about an 80-fold multiple of unknown cases. Likely, the truth is somewhere much closer to the former, given Iceland and NY data. But this measure is very uncertain.
3. RECOVERIES: These are the registered cases who got well again. Some national sites report that statistic, but in California only ONE county has posted recent numbers visible in the state’s website. Worldwide, it looks like almost 20% of cases die; in this country it looks like 29%, but if we’re not tracking recoveries then that Case Fatality Rate is too high.
4. TEST RESULTS: The nasal swab test has 30% inaccuracy; other tests are much better, but are expensive, or present other risks, or are just not available in volume (e.g. CAT scans). A recent study of 12 antibody (after the fact) tests showed only four (4) were accurate enough to be reliable – yet some of those tests are the basis for the inflated case estimates mentioned above. One MD told me that if you’ve had SARS, MERS, or even some variations of the common cold (also a coronavirus) you can test positive. Out of 90 available such tests, only four (4!) are FDA approved.
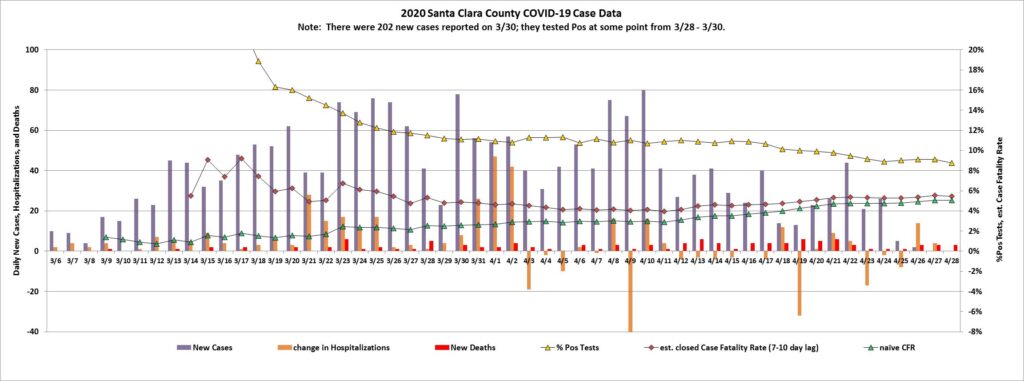
Bottom line, you can’t believe much CV-19 data is accurate. What you CAN do is define a metric, update it consistently, and track the trends. Trends can then have meaning. We’ve done that with the data from our prior article, and here’s what we find:
Notice that, since we ran this graph in our April 9th article, the naive CFR (was 2.9%, it’s now 5.1%) and the lagged 4-day estimator for Closed CFR (was 4.0%, now 5.5%) have converged. We claimed in the article that nCFR should be bounding the true case fatality rate from below, while our lagged estimate should be bounding it from above. So now we have a narrower range, and it has been climbing. As of 28 Apr, somewhere between 5.1% and 5.5% for SCC. Again, this Case Fatality Rate applies only if you’ve been tested and treated for CV-19.
[Click to Enlarge]
4. SO WHAT TO DO?
What’s needed to reopen is not a DATE, it’s PREPAREDNESS, and that includes:
1. TESTING: enough to cover not only those seemingly ill and the first responders and the essential workers on a frequent basis, BUT ALSO to regularly survey communities throughout the state periodically to find emerging hot spots so they can be controlled before they explode.
2. TRACING: ability to contact trace every case found, to identify those exposed to that person, and to test them and to…
3. QUARANTINE: those at risk of infecting others – whether at home or in hotels.
4. TREATMENT CAPACITY: both in terms of PPE, vaccines or cures, health care facilities and staff, and all the equipment they need (whether ventilators, CAT scanners, CPAP masks, etc.)
5. SAFETY PROTOCOLS: Including not only hand washing and social distancing, but also PPE for use by individuals outside of homes, and safety protocols for places and events that previously were crowded: sports, funerals, churches, classes, concerts, restaurants, etc.
Finally, a word from a health care manager in Seattle:
“So tell me again why it’s OK for states to be forging ahead and aggressively reopening right now? Is that based on an accurate understanding of what is happening? Or is it because of that special combo of ulterior motives, willful ignorance, and plausible deniability (based on manipulated stats) that has historically proven to produce awesome governance decisions?
Seems like a great time to reopen.”
Now that’s from a health care professional in Seattle, under stress. What I’d say is that there is a balance between life and death, and I’m not ready to tell others where to draw the line. I’ll continue to defer to the professionals. What I strongly feel is that we are not yet prepared for a full reopening. And every one of you gets a vote as well. Even if Government tells us it’s OK to Open Up, I doubt we’ll see crowded participation. “Let every man be master of his time.”





Today San Mateo County Health finally posted Data by Zip Code and before you get too excited…. They left out El Granada’s Zip Code 94018. Thinking they lumped it in with Half Moon Bay 94019, I called SM County Health to ask. The very nice woman named Wanda called me back and after checking with the number crunchers, they told her they had left out ELG and had not lumped them in with HMB … but rest assured there are fewer than 10 cases in ELG. They say they will update those numbers every Friday, so we’ll have to wait and see if they fix it.
http://www.smchealth.org
Thanks Cid! Nice work.
Just to put this in context; 20 cases in HMB, the population of HMB according to Wikipedia was 12,973 — so that suggests, if my math is right, that the active rate is 0.15% which by most statistical measures is very low risk. I appreciate the need to take precautions like wearing face masks and wholly embrace the need for social distancing. I am not advocating going back to “normal”. But to exclude simple things like being able to take a drive when there is little risk of exposure or see the financial devastation of small businesses — I would prefer our political leaders at least implement more flexibility. You can only go to the beaches if you live within 10 miles of them? Really? People have mental health needs too that seem woefully neglected. Net net, I think the current set of requirements as outlined for the month of May is far too restrictive.
Certainly my dog and I agree with you on recreation. In fact, why don’t we allow elective medical procedures? It shouldn’t be too hard for MD offices to keep us spread out and would help alleviate bankruptcy in hospitals, etc. There are likely other examples. What I can’t fully grasp yet is the economic vs. health balance. It seems a LOT of economic damage was done by just letting the virus loose to start. That damage is going to take years to repair. So, how much MORE damage, including to the healthcare system, will be done with repeated spikes of infections? Certainly Sweden is going to show us the answer, but we’ll have to wait 2 years or so to see it. For now, I’m going with the experts, and besides, I don’t have a firearm to storm the Capitol with…
@HMB 20 YEARS- perhaps they thought if they didn’t set the 10 mile restrictions then everybody and their brother would flock to our beaches. They must know that there will be at least a few scofflaws anyway, but why create an even greater opportunity for community spread? This is conjecture on my part, but they must have weighed the options. Just hearing all the folks complaining about “police states” and “restrictive punishment” on NextDoor makes one realize it will be unpopular, not to mention controversial. We’ll get out of this in one piece (one hopes) while we watch in horror as the rest of the Country has flare-ups and deaths. I can be mature about this, and forego a trip to the Beach while we wait this pandemic out!
Just did a little late night math on HMB case incidence. If we calculate the cases per million for HMB, assuming 20 cases and a population of 13,000, that works out to 1,538 cases/mill. That rate puts HMB in between the states of Tennessee and New Mexico – in the “Watch Out” category of states which are worse than the California average. Compared to the 9 Bay Area counties, that would be the 3rd worst rate, after San Mateo and SF. So, 20 cases (and I hope that’s all it is) is Not Great.