|
Getting your Trinity Audio player ready...
|
OWN VOICE. ~ InPerspective by Gregg Dieguez —
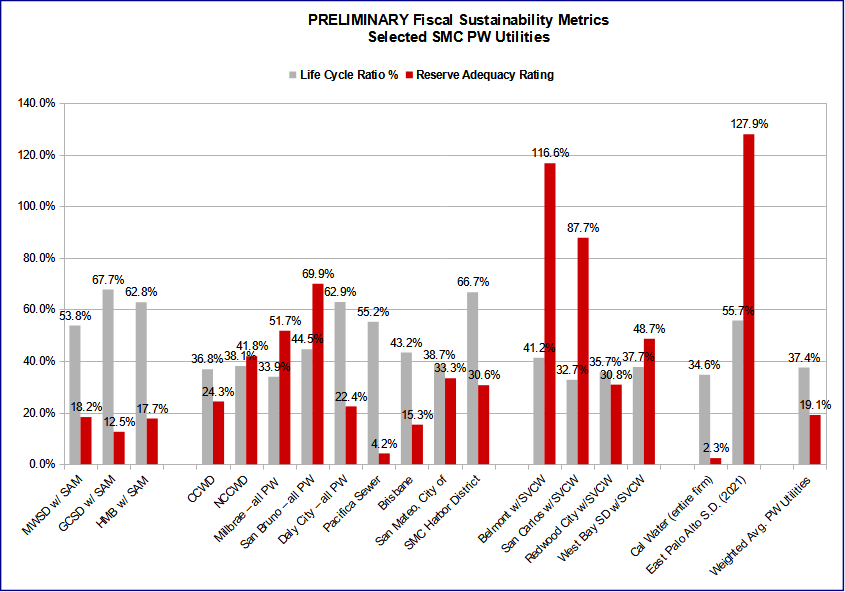
A review of selected Public Works Utilities in San Mateo County shows very few entities in a fiscally sustainable position, and some potentially very troubling situations. The weighted average results of the utilities shown in the graph below shows they have only 19.1% of the reserves required to replenish their aging assets without borrowing. The total Capital Reserve Deficiency is over $2.5 Billion. Put another way, for the Reserves on hand to be adequate, the assets involved would have to last another 180+ years.
Footnotes: to use, click the bracketed number and then click your browser Back button to return to the text where you were reading.
Images: Click to enlarge for improved readability in a new window.
This article discusses the findings of applying a methodology for assessing Public Works Fiscal Sustainability which was published here: The Iceberg of Public Works Deficits. Below we flag the major findings of this preliminary review, factors which could influence the accuracy of these findings, and next steps for research.
The following graph shows two figures for each utility analyzed:
a. The Life Cycle Ratio, which is the percentage of the asset lifetime already exhausted.
b. The Reserve Adequacy Ratio, which is the percentage of reserves on hand compared to those required.
c. At far right is the weighted average result for all other utilities shown on the graph.
Highlights:
1. The weighted average numbers are heavily influenced by Cal Water, which represents over 60% of the current replacement cost of the assets involved. Cal Water’s Reserve Adequacy ratio is 2.3%, the lowest of any utility included in this sample.
2. There are two utilities showing EXCESSS reserves: Belmont and East Palo Alto.
3. A few other utilities appear to have sufficient reserves when only viewed as a standalone entity (e.g. HMB). However, they are participants in Joint Powers Authorities and share ownership of assets such as wastewater treatment plants and sewer outfalls. When the financial condition of the JPA is allocated to the member agencies, it is apparent that the off-balance sheet JPA asset burden places most utilities in a deficit reserve condition.
4. Next to Cal Water, the worst financial condition is in Pacifica, with reserves at 4.2% of those required. Pacifica is exploring $80M+ of borrowing and a 5 year 3.5% annual rate hike as part of $125M in proposed capital expenditures.
5. More research is needed to ensure that the data properly includes assets from related utilities. For example, East Palo Alto doesn’t include any allocation for a treatment plant. There are several water and sewer networks of municipalities in San Mateo County, and this preliminary review may not properly include off-balance sheet asset burdens for all.
6. I am comfortable, subject to the potential errors discussed below, that the numbers for Pacifica, SAM and its 3 member agencies, the Harbor District, and the independent water agencies CCWD and NCCWD are reasonably accurate.
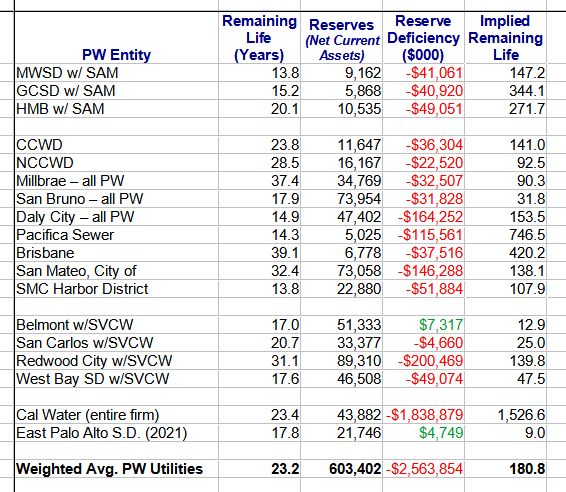 The table at left shows for each utility the remaining life of assets on the books, the amount available for reserves, and the shortfall or deficiency in that reserve amount (a green, positive amount is GOOD, meaning excess reserves). The Implied Remaining Life is the number of years the utility’s assets would have to continue to survive in order for the current level of reserves to grow sufficiently to fund replacement. The numbers for SAM and SVCW members are inclusive of allocations from their ownership in the JPA [Shown in the footnote 1].
A Critical Assumption:
This analysis assumes that a utility should have reserves proportional to: a) the current replacement costs of its assets, and b) the age of those assets. When that is the case, a utility can pay cash to replace the aged assets necessary, and will not need to borrow. Yet, “the entire industry is addicted to debt” in the words of one leading figure. The question is: Is it time to change this practice? Pacifica’s recent rate study anticipated borrowings at 4% for 30 years that would have added 73% to the cost of each asset so funded. San Mateo has borrowings of over $400M, of which $331M was sewer-related at rates varying from 4 to 5%, and will pay about 80% of the cost of those assets in borrowing costs. Given the Fed’s rate hike yesterday, today’s mortgage rates of over 5.1% – which would add interest costs of over 95% to any assets so funded, may be going away for years. At 6%, you pay 116% in borrowing costs; at 7% you pay 140%. And these borrowing costs further undermine a utility’s ability to accumulate reserves. So, my assumption that utilities should avoid borrowing may seem strict, and may have been viewed as optional when interest rates were 1% or 2%, but for the forseeable future, I submit that a Reserve Adequacy Rating based on not borrowing is the fiscally responsible approach.
Could I be wrong?:
Let’s examine the potential sources of error which could affect these findings.
1. Utilities Can Stretch The Lifetime Of Assets:
This is mentioned in the article on methodology as the primary factor which could improve the fiscal sustainability of public works, and is a common practice. However, San Mateo County, and especially the Coast, is vulnerable to a wide range of natural disasters and conditions including: earthquakes, tsunamis, wildfires, sea level rise and corrosion from salt water air. It will require a detailed Asset Management Program at each utility to assess how much extra life can be obtained, but the author views it as unlikely that assets can be stretched an additional 25 to hundreds of years, which is the range of extra lifetime required for the utilities surveyed here to avoid borrowing.
2. Reserves Are Over-Stated:
The methodology used in this analysis credits a utility for every dollar of Net Current Assets as Reserves available for Capital Replenishment. This is overly generous, as utilities have needs for working capital and other types of emergency or mandated reserves. In some cases, this simplifying assumption has doubled the amount of Reserves actually retained for capital needs. However, due to the lack of public financial statement information about capital reserves, this treatment is required for comparability.
3. Some Assets Are Under-Valued:
Several utilities have assets which were acquired at low prices, or donated by developers, and which are booked at low dollar amounts. Other utilities have assets which are fully depreciated, and thus show as Zero dollars in the asset inventory and in depreciation expense, when in fact these assets are likely most in need of replacement. Thus, the calculations in this analysis OVER-state the fiscal sustainability of those utilities.
4. Some Assets Are Not Included:
This analysis omits Land, because it is not a depreciating asset. Clearly the replacement cost of most land is much higher than the Book Value. For some utilities, vulnerability to sea level rise means that they will have to move to new, more expensive land in the coming decades. Omitting consideration of the replacement cost of land is OVER-stating the fiscal sustainability of those utilities. In addition, several utilities have large amounts of construction in progress, which is not yet being depreciated. Omitting those impending assets in this calculation may thus OVER-state the fiscal sustainability of those utilities, but until the actual depreciation schedules and expenses are known, it is consistent with accounting principles to consider them a non-depreciating asset and omit them in this analysis. Certainly new assets would not be expected to require significant reserves.
5. You Got The Wrong Numbers:
In order to ensure I captured the data correctly from the last annual financial statements, I forward what I captured to the utility involved, showing the source document used, and I show the resulting calculations for their utility as a stand-alone entity (that is, before allocating any shared JPA assets). It is the case that municipal financial statements are convoluted to the point of being obscure when it comes to Public Works. There are unusual fund transfers and contributions in some years, as well as non-depreciable asset values for JPAs which change in surprising ways, and which don’t come close to reflecting the full asset burden involved. Special Districts, on the other hand, have cleaner financial statements and have provided clearly detailed Asset Inventories – in contrast to Municipalities who provide nothing, or provide sloppy and unclear numbers which don’t foot to the annual financials. To date, I have received no corrections, but it is certainly possible that there will be some corrections, and I will update this analysis as needed if and when that happens.
6. Things Would Look Better If You Analyzed The Detail:
As mentioned in the methodology article, there are more detailed ways to calculate the current replacement cost of assets. In fact, I will do this shortly for utilities which have provided me with usable asset inventory detail. However, a couple of examples will demonstrate that a detailed analysis will likely result in a poorer fiscal sustainability rating. Given recent inflation, sewer collection pipes will cost about $2M per mile to replace. In HMB, there are ~35 miles of collection system pipes, which would be worth $70M in replacement costs. Yet, HMB has only $4.6M in Sewer Assets on their books. Similarly, in Pacifica there are over 100 miles of sewer collection pipes, worth about $200M, yet Pacifica has only $56.6M of Sewer Assets on their books, and that includes a plant at $27M (which will actually cost much more to replace). There are similar examples in other utilities, including the overstatement of capital reserves mentioned in point 2 above, which when analyzed in detail would make things look worse. In sum, I expect that using the Detailed Method to develop the Current Replacement Cost for public works assets will result in much poorer Reserve Adequacy Ratings.
7. You Allocated the JPA Financials Incorrectly:
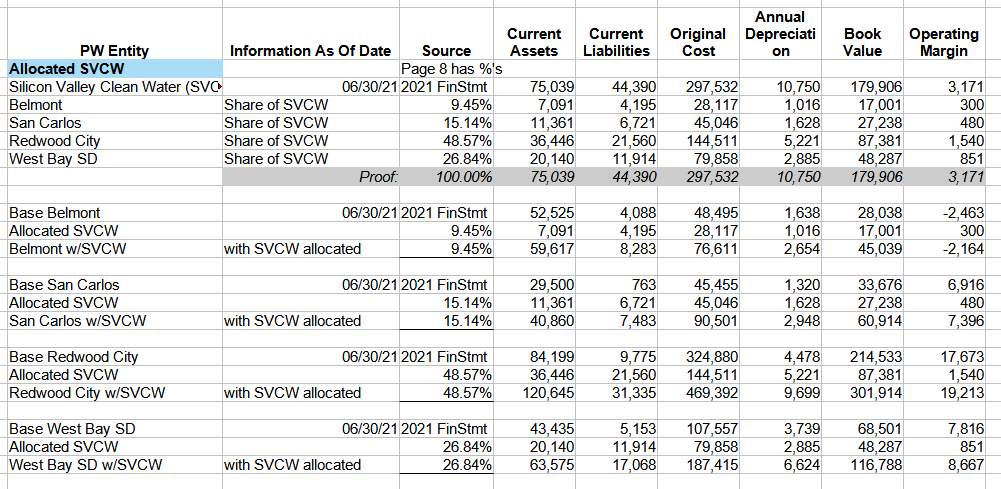
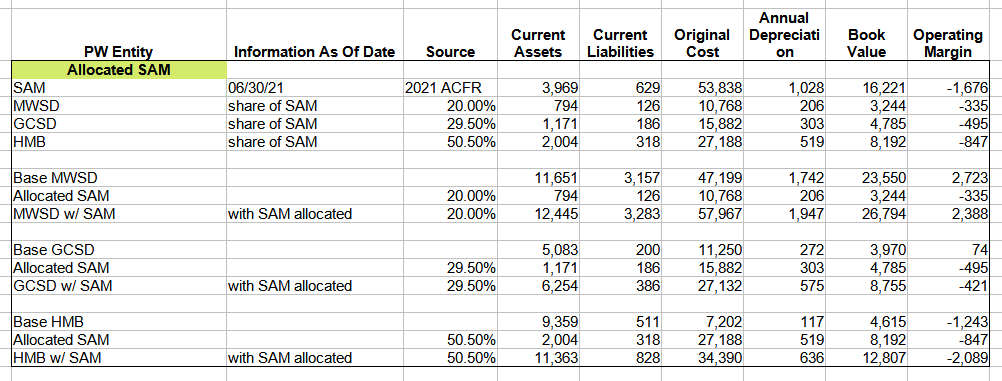
In order to allocate the financial data for a shared entity, you have to make an assumption about the percentages which apply to each co-owner / partner. In the case of Silicon Valley Clean Water, there are different percentages for assets and expenses for each member agency. I chose to use the asset percentages, but they are within a percent or two of the others, so even though I may learn from the SVCW CFO that my numbers are imprecise, I doubt they will be materially affected. With SAM, I used the ownership percentages as a basis for allocation. HMB owns 50.5% of SAM but is contributing about 60% of the plant flows. Had I used 60% for the HMB allocation, then GCSD and MWSD would look better, and HMB worse, than currently depicted. I will revise as appropriate after consultation with those agencies. [Allocation details for SAM and SVCW are shown in the footnotes[1]]
What Next?
I have pending inquiries with several utilities/cities about their numbers, and the allocations of shared resources appropriate for them. Certainly Cal Water is a major surprise, as it serves cities from San Jose up through our County. I hope further research will show they are not as badly capitalized as it appears. We need to analyze every utility involved in JPA’s in the County and confirm what allocations are appropriate. There are a number not included here. Frankly, any utility that seems to have adequate reserves is suspect to me, certainly East Palo Alto with pressure from LAFCO to have residents subsidize a new development’s infrastructure[2]. We need an independent audit of Public Works’ financial condition County-wide to determine just how large the hidden deficits are. A subsequent article will analyze how and why our utilities got into this situation, and recommend remedies.
FOOTNOTES:
[1] Allocation of JPA Assets to Silicon Valley Clean Water Members
 Allocation of JPA Assets to Sewer Authority Mid-Coastside Members
[2] Notes from EPASD financials:
Today’s LAFCO vote needs further analysis, but from the 6/30/21 financial statements it appears that recent transactions in this regard are a wash and do not affect these calculations.
pg 7 “an increase in developer fees of $591,622”
pg 18 “On September 1, 2020, the District reported a developer deposit to develop a 185-unit affordable housing sewer project. The initial deposit reported an amount of $2,469,185. At June 30, 2021, the District reported capital expenditures of $591,622. The deposit shall be recognized as revenue only at the point the fees become nonrefundable. For the year ended June 30, 2021, $591,622 were reported as developer fees.”
If the unspent portion of that deposit were reduced from Current Assets, the District would still have a high Reserve Adequacy Rating. Further, there is $1.8M in Restricted Cash which is NOT included in Current Assets. Until I am able to speak with the EPASD financial staff, I am not adjusting their data.
 More From Gregg Dieguez ~ InPerspective
Mr. Dieguez is a native San Franciscan, longtime San Mateo County resident, and semi-retired entrepreneur who causes occasional controversy on the Coastside. He is a member of the MCC, but his opinions here are his own, and not those of the Council. In 2003 he co-founded MIT’s Clean Tech Program here in NorCal, which became MIT’s largest alumni speaker program. He lives in Montara. He loves a productive dialog in search of shared understanding.




Great work. Much appreciated.