|
Getting your Trinity Audio player ready...
|

ARTICLE OWN VOICE, OWN WORDS.
When you first heard about COVID-19, your reaction was likely “Am I going to get sick and/or DIE from this thing?” Followed closely by: “Is someone I CARE ABOUT going to get sick and/or DIE from this thing?”. Followed, with some delay, by financial, economic, social, and cultural concerns. All that is completely understandable. Less so, is why you can’t get answers to your first question.
In March, when the media were reporting that the “death rate” in Italy was running at 9%-10%, people became very concerned. Death statistics from the 1918 flu pandemic only fanned the flames. Fear and uncertainty started to take root. And the closed Case Fatality Rate in the U.S. was up to 69%, before data on patient recoveries starting coming in; it has now dropped to 37%, and is still trending down.
So how worried should we be, given that we are in the Bay Area?
Local county data are incomplete, but our estimates are that if you are hospitalized with COVID-19 you face between a 3.3% and 5.5% risk of mortality. However, the disease severity varies greatly by age, with patients over 60 facing at least 8.8% mortality, while the rest at risks of over 1.2%. There are also important considerations related to adequate distancing, and to intubation, so please read on…
Two weeks ago when I looked at the COVID dashboard for the San Mateo County (SMC) Dept. of Public Health, it made me weep. Not because the numbers of cases and deaths were scary (at least not Italy or New York scary); but because it left me with more questions than answers. Since then the site has gotten steadily better, in terms of data completeness and ease of understanding with good graphics.
The current SMC COVID-19 dashboard is a good start, but there are some important improvements that could increase its value to the public. More information, even if not all of it is good news, can calm fears and guide people to act to reduce their personal risk, and the overall community risk.
Ideally, a county’s published COVID-19 data should address three broad areas of public concern:[1]
1. How is the disease advancing, locally? Are non-therapeutic mechanisms (stay at home, physical distancing, face covering, hygiene) working to limit the spread? Are we flattening the curve, or seeing exponential growth? To answer this, the site should display:
– time series for all statistics (so we can see trends)
– onset and outcomes by age group (tests, pos. & neg; hospitalizations, acute and ICU; recoveries; deaths)
– cumulative per capita ratios, e.g., cases per thousand residents
– comparisons to other localities (in the Bay Area, state-wide), e.g. Sonoma Co.’s cases graph
2. Will the growing burden on hospitals, health professionals and other Public Health resources overwhelm the treatment system?
– Capacity utilization over time (acute beds, surge beds, ICU beds, ventilators)
– Is the trend suggesting we are in danger of overwhelming the system?
3. More selfishly, what is the personal risk to each of us, of infection and death? What can the statistics for testing, confirmed cases, recoveries, and deaths tell us about our chances, given our age, sex, and pre-existing conditions? How is that risk changing over time?
– This is why it’s important to have time series by demographics, and we need:
– Estimates by age group for the Closed Case Fatality Rate (cCFR)
– Estimates by age group for Infection Fatality Rate (IFR) – this is the percentage of all infections (both diagnosed and undiagnosed) resulting in death. This much harder to calculate because without widespread testing before and after (with antibody tests) we don’t know the true rate of infection in the population.
Death Rates explained
What is the real underlying mortality rate for COVID-19 victims here, and why does it appear to be so different from region to region? Some variations arise because there are different metrics that can be calculated from the numbers for testing, cases, deaths, and recoveries. Each of these metrics has advantages, but all are just estimates of the true mortality rate in the underlying epidemic process. They each have inaccuracies due to limitations of observability, measurement and reporting – and you’ve probably heard there are inaccuracies in reported deaths, cases, tests given, and recoveries reported. But we do the best we can, and hope that as we get larger numbers and more practice, we’ll get more meaningful statistics.
One estimate the press often reports for the underlying mortality rate is the simple ratio of cumulative confirmed deaths to cumulative confirmed cases, because this data is more readily available. This number is referred to by epidemiologists as the naïve Case Fatality Rate (nCFR).
naïve CFR = (Confirmed Cumulative Deaths)/(Confirmed Cumulative Cases)
When more complete data on patient outcomes is available (the number of recovered, as well as deaths), doctors and hospitals calculate the Closed Case Fatality (cCFR) Rate:
closed CFR = Deaths/(Deaths+Recoveries).
For example, In Sonoma County, as of 8 Apr, there were 123 confirmed cases, and only 1 death. So the naïve CFR at that point was 0.81%, and the closed CFR was 2.27%. With only one death, and under 130 cases, it’s dangerous to conclude much about the underlying process. For SMC, because we lack data on recoveries, we can only calculate the naïve Case Fatality Rate, which as of 6 Apr, was 3.57%.
So what is wrong with using the naïve CFR as an estimate of the underlying mortality rate? Well, the naive CFR has multiple sources of error. Perhaps it’s higher, maybe it’s lower than the closed CFR will turn out to be, when all patient outcomes are recorded. Here are some sources of error:
– The numerator only takes into account Confirmed Deaths. This may sound ok, but that number tends to be an underestimate, because of the reporting challenge, esp. if someone dies outside a hospital, but even if in hospital. Did the patient die from organ failure, or from COVID-19? What gets recorded? Were test kits used to test a fatality, or was there a test kit shortage requiring them to be conserved for the living?
– The denominator only takes into account Confirmed Cases. If a significant proportion of those infected remain asymptomatic but recover, or just choose to recover at home even after testing positive, then those people often won’t be reported as recovered and the Naïve CFR will be inaccurately high. Recently the CDC estimated that the proportion of asymptomatic infections is in the range of 25% – 40%. Also, as a local data point, Sonoma Co. is showing that (as of 2:30pm, Wed, 8 Apr) of 123 confirmed cases, 20 were hospitalized, and 103 were not.
–The denominator counts cases that came after the date of diagnosis; and it ignores that different fatalities have different time courses from diagnosis to death. Imagine for a minute that the disease duration is identical – from the day of testing positive, to the day of death – for all patients who die. Then the patients who die on day N would be among those who tested positive on some prior day, exactly T days earlier. So if we use the cumulative case count on day N in the denominator, we are using an inflated number of cases, some of which began after the group of infected patients for which day N deaths occurred. When daily new cases are rising sharply (the denominator), this can introduce a big error, and the naïve CFR will be much lower than the true cCFR.
Of course in reality people’s disease courses are all different. Ideally we would know the distribution of those courses, and could then apply an appropriate weighted average of case counts across prior days. But we don’t know the real distribution, so we propose a simple average of cases taken over a particular lagged window of prior days. Averaging over multiple days also helps to smooth the sometimes lumpy reporting of new cases. (For example: on 30 Mar, Santa Clara Co. (SCC) reported 202 new confirmed cases, with the note that these were confirmed at unknown points on the three days from 28-30 Mar.)
We’re using here a lagged 4-day average in the denominator, averaging the cumulative Cases from 7, 8, 9, and 10 days prior[2]. Here is the spreadsheet formula for estimating the cCFR as of day d:
cCFR(d)=[cumDeaths(d)]/average[cumCases(d-7):cumCases(d-10)]
And the closed Case Fatality Rate also has problems. First, the same errors can exist in the count of fatalities. Second, it also only includes confirmed cases, and the true number is likely much larger. Third, the number of recoveries could be lagging in our collection of data. Bad news travels faster.
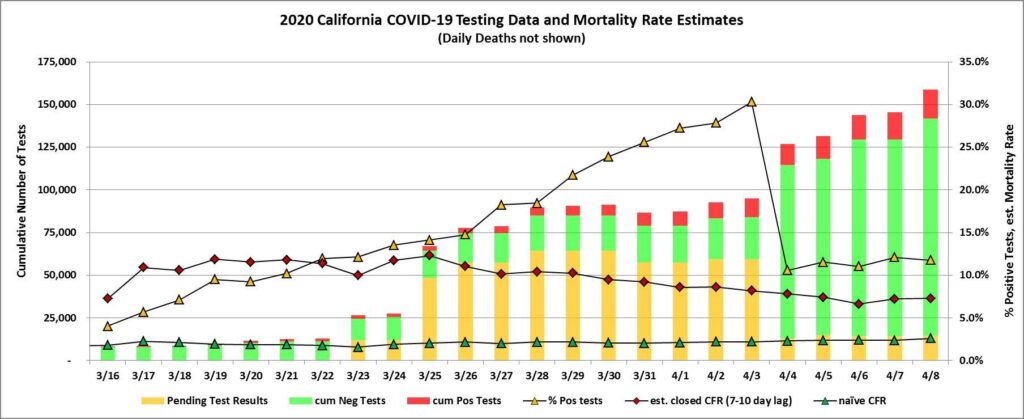
So what does this new cCFR calculation tell us about the mortality rate? Here is a graph of the case data from Santa Clara County (SCC) for the last month (where full time series data are available), showing naïve CFR and our smoothed estimate for cCFR using lagged 7-10 day case average:


Analysis of Findings[3]
The smoothed and lagged estimate takes a while to settle down, due to the initial small sample size. The SCC naïve CFR as of 8 Apr is: 3.3%. This is probably a low estimate of the closed CFR, while our current lagged estimate of 5.5% is probably a high estimate. Thus, currently the current underlying mortality rate in SCC is likely to be between 3.3% and 5.5%. In California as a whole the nCFR is currently 2.6%, the cCFR is 7.3%. But remember these ranges are an estimate, for people of all age groups, who were sick enough to need to go to the hospital. And there are marked variations in fatality by age group.
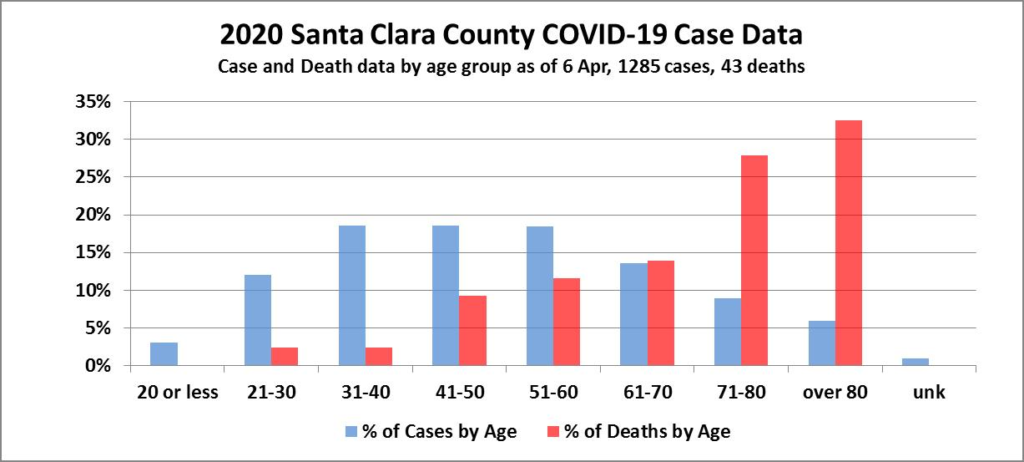
Below is a chart that illustrates the big difference in outcomes for different age groups that has been observed in SCC. As of 6 Apr 2020, patients over age 60 accounted for 28.4% of cases, but 74.4% of deaths. Conversely, patients age 60 and under accounted for 70.7% of cases, but only 25.6% of deaths. Put another way, patients over age 60 in the first month of the epidemic have a naïve CFR of 8.8%, while those 60 and under have a naïve CFR of just 1.2%. So the danger for older folks in the Bay Area is significantly greater, as was the case in China and Italy.

So What? – or – Implications:
Going back to the important question, “What are the chances I’ll die from this?”
Answer: they’re much better if you stay out of the hospital. Internal NYC hospital memos document “… the likely mortality is 50 to 80 percent for patients needing intubation, especially those with pre-existing lung or cardiac comorbidities.”[4] There is also recent evidence that intubation may not be the best treatment for all oxygen-depleted patients.
What To Do:
- Stay home so we can get this pandemic over sooner;
- Wear a mask when making essential trips to enclosed spaces;
- Practice physical distancing (Don’t believe that cough droplets only travel less than 6ft. The distance can be over 25 feet per an MIT study. See links below.[5];
- Have a decontamination procedure for bringing groceries, sundries, yourself, your clothes and your shoes – back into your home.
- Last thought: if you do test positive, and have to go into the hospital, remember, this isn’t Italy. In the Bay Area at present, we DO have sufficient beds and ventilators because of the good work all of us have been doing so far. So, think positive if you test positive.
Open Question:
Why don’t the published COVID-19 data for San Mateo County, and most of the other Bay Area counties, include testing or recovery stats? One can debate whether the smoothing technique we use herein is the best, but without data on recoveries, how are we ever really going to know the mortality rate?
Authors’ Backgrounds:
Bruce and Gregg were housemates at MIT, and know just enough statistics to be dangerous.
Technical Explanation, Footnotes, and Sources:
[1]
Sampling of Bay Area County COVID-19 site links:
- Marin: https://www.marinmommies.com/keep-track-covid-19-county-marin-hhs
- https://coronavirus.marinhhs.org/
- Contra Costa: https://www.coronavirus.cchealth.org/
- plus Dashboard: https://www.coronavirus.cchealth.org/dashboard
- Alameda County: http://www.acphd.org/2019-ncov.aspx
- San Francisco: https://data.sfgov.org/stories/s/San-Francisco-COVID-19-Data-Tracker/fjki-2fab/
- San Mateo: https://www.smchealth.org/post/san-mateo-county-covid-19-data-1
- Santa Clara: https://www.sccgov.org/sites/phd/DiseaseInformation/novel-coronavirus/Pages/dashboard.aspx
- The Following Counties were NOT part of the initial shelter in place:
- Sonoma: https://en.wikipedia.org/wiki/Portal:San_Francisco_Bay_Area
- also: https://norcalpublicmedia.org/track-sonoma-county-coronavirus-cases-and-test-results
- Solano: http://solanocounty.com/depts/ph/coronavirus.asp
- and https://doitgis.maps.arcgis.com/apps/opsdashboard/index.html#/6c83d8b0a564467a829bfa875e7437d8
- Napa: https://www.countyofnapa.org/2739/Coronavirus
- and https://legacy.livestories.com/s/v2/coronavirus-report-for-napa-county-ca/9065d62d-f5a6-445f-b2a9-b7cf30b846dd/
- California: https://norcalpublicmedia.org/2020040642477/news-feed/california-covid-19-tracker-gives-county-by-county-look-at-cases-deaths
[2]
Why we use a 4 day average of cases from 7 to 10 days prior, to estimate the cCFR:
There have been various estimates for T, including 7 days, 14 days, and even higher numbers from WHO. Recently, WHO reported that the time between symptom onset and death ranged from about 2 weeks to 8 weeks. And, of course, all these estimates come with a probability distribution of numbers and the confidence thereof. See:
https://www.worldometers.info/coronavirus/coronavirus-death-rate/#correct
and:
https://www.thelancet.com/journals/laninf/article/PIIS1473-3099(20)30195-X/fulltext
Given the average incubation period for the virus, which is 5 to 7 days, testing could not detect the virus until then. Subtracting that period from an estimated disease course of 2 weeks, or 14 days, leaves 7 to 9 days for a detected case to progress to mortality. We’re using a tenth day to account for the few U.S. cases which take longer.
[3]
How we calculated the recent fatality rates:
How we calculate these two metrics for Sonoma Co.: The data as of 3:30pm, Wed, 8 April 2020: Confirmed Cases: 123 Active: 79 Recovered: 43 Deaths: 1 which gives: Naïve CFR: 0.81% (1/123) Closed CFR: 2.27% (1/(43+1))
For comparison, what is the Naïve CFR for San Mateo Co.: Data last updated Mon, 6 Apr 2020. Last checked 3:40pm, Wed, 8 Apr. The data: Confirmed Cases: 589 Active:?? Recovered:?? Deaths:13 which gives: Naïve CFR: 2.21%(13/589)
[4]
Sources for Intubation Mortality:
- JAMA Intern Med. 2020. doi: 10.1001/jamainternmed.2020.0994. [Epub ahead of print]; https://bit.ly/2V3vFTZ;
- N Engl J Med. 2020. doi: 10.1056/NEJMoa2002032. [Epub ahead of print]; https://bit.ly/3bDobxu;
- China CDC Weekly. 2020;2[8]:113; https://bit.ly/2wHYAVv;
- N Engl J Med. 2020. doi: 10.1056/NEJMoa2004500. [Epub ahead of print]; https://bit.ly/2WT5LES;
- JAMA. 2020. doi: 10.1001/jama.2020.4326. [Epub ahead of print]; https://bit.ly/2UO0EDm.
Note that these studies are being released before full peer review, because of the critical need for information to fight CV-19.
MIT Prof. Lydia Bourouiba, JAMA article (w/video of cough cloud) “Turbulent Gas Clouds and Respiratory Pathogen Emissions: Potential Implications for Reducing Transmission of COVID-19”
and,
Video from NHK World, Japan. “Beautiful demonstration of micro-droplet i.e. airborne virus : Coronavirus.” https://www.reddit.com/r/Coronavirus/comments/fu7c1u/beautiful_demonstration_of_microdroplet_ie/?utm_source=share&utm_medium=web2x


I’m a bit of a statistics junky too, and to the extent the actual data is available, there are a number of sites that show cumulative data over time, and various breakdowns (at the county level for California). The data gets better over time. And there are glitches as the recent jump from 13 to 21 deaths showed, when there was no update due to data problems for over a week. It wasn’t 8 more overnight, it was 8 more over the course of a week. But still, San Mateo and other counties are improving.
For hospitalization data, including covid ICU use (both confirmed and suspected) by county, see https://public.tableau.com/views/COVID-19PublicDashboard/Covid-19Hospitals?:embed=y&:display_count=no&:showVizHome=no ; that only shows state cumulative, but the underlying data are available on that site so you can do per-county cumulative. Some of the newspapers are doing similar things (LA times is one, and I think I saw it on the SF Chronicle site as well).
I appreciate the desire for sub-county level data, but really, of what use is it in making decisions (as individuals or as health provider/planners)? I’m genuinely interested in why you think it’s useful. I’ve had discussions with other people, and either it’s a misunderstanding of the data, or just “I want to know”.
Sure, if we had 100% testing of the population (or even something approaching it), then local data might help you assess the risk of associating with people in your general neighborhood (zip codes wouldn’t be too useful for us, since we have everything from El Granada down to and including HMB in 94019). But we won’t have that for months, and quite possibly well over a year. Since general wisdom is that we have between 5-20 times as many people positive (but asymptomatic, or very light symptoms) as those confirmed (or even suspected) positive, the localized data is essentially worthless, except as a statistics junky. It wouldn’t help us as citizens, or the health system make any useful decisions, so far as I can see.
And since we have very few hospitals in the county, it’s hospital utilization that is more important than which zipcode or community a resident lives in, for care purposes.
I hope I didn’t request SUB-COUNTY data. I agree, don’t see the point in that. Agree with much of your comment. Your statement of ‘5-20 times people positive’ flies in face of published stats estimating asymptomatic infections is in the range of 25% – 40%, the high I’ve seen from “respectable” pubs is 50%. BUT, to your major point, and we encountered it repeatedly in researching this article, the DATA ARE MESSY. It could be higher. I feel, at this time, that it IS worth a large effort to MEASURE as many people as possible: to identify cases for control, to determine the real level of risk, and – when antibody tests are reliable/available – to determine how safe we all are. I’m guessing many aspects of our future society will be driven by either Fear or Facts related to this and similar diseases, and I think the latter are preferable, if costly. Thanks for taking the time.
P.S. I am aware that at least one family in my neighborhood has/had CV-19 and it’s likely two.
I misinterpreted your use of “locally” to mean “sub-county”, sorry about that. I would say then, that all the data you want is already available, although not always in easily digestable form. As this continues, the data presentation will become more standardized, due to insurance, state, and CDC reporting guidelines becoming better defined. I have a friend who does insurance coding (at the meta level, as well as as some individual doctors) for major health systems, and she tells me that the insurance companies are changing on a daily basis right now in what they want, and what they send out. But it is starting to settle out.
And in particular, the hospital data is definitely there, and reasonably well presented by the major counties, and summarized well at the state level. It’s looking like with the added beds, and reopening of closed facilities, and the slowed growth rate of covid-19, that the Bay Area is not going to overwhelm it’s hospitals, unless we end up with a shortage of nurses, doctors, etc. due to them getting severely ill (and there are early signs that might happen, with a significant percentage catching covid-19 outside the health system, that is, from families or friends, or other close contact outside the hospitals).
I don’t think interpreting the data even on a per-county basis makes a whole lot of sense, except as a way of evaluating different ways of handling issues. Regional (in terms of common movements of people, goods, presences of hospital systems) is probably more useful, and I think that’s why the Bay Area counties tried to standardize (at least at the 95% level) their requirements and recommendations. Clearly they are also trading info on how to present data (both internally and publicly).
Thank you very much. It has become apparent, eg recent WF HMB exposure, that there is no obligation of an employer or other person to disclose to others when they know exposure exits. Staying within HEPA Privacy, how can this issue be bridged? Without excess government invasion of personal privacy and protection?
I cannot answer, let alone enforce, protocols related to that issue. What I would note is that there is a notable tension between First Amendment rights and public health and safety, so we have two aspects of the Constitution in conflict with each other. I would further note for thought, as I am still doing, the distilled essence of wisdom from two of the foremost historians of the 20th century, Will and Ariel Durant, who said:
“A right is not a gift of God or nature, but a privilege which it is good for the group that the individual should have.”
— so I’m still thinking about that, and what type of New Constitution we might craft.