|
Getting your Trinity Audio player ready...
|
 OWN VOICE. ~ InPerspective by Gregg Dieguez —
Your public works infrastructure is decaying without a fiscally sustainable plan to replenish it. Allowing public works to fall into disrepair will lead to critical failures which will ultimately burden residents more when costly emergency remedies become necessary. This article begins the process of addressing this problem by establishing a method for quantifying these hidden deficits[**]. Subsequent articles will publish and analyze the deficits in several local public works utilities, and identify both reasons and remedies for the problems.
Footnotes: to use, click the bracketed number and then click your browser Back button to return to the text where you were reading.
Images: Click to enlarge for improved readability in a new window.
This article proposes a simple normative and comparative methodology to assess the fiscal sustainability of public works utilities[1], and proposes new national AWWA benchmark statistics to surface and manage the iceberg of public fiscal liability attendant to our critical utility infrastructure.
Problem
The AWWA, the ASCE, and other national professional organizations have long discussed the failing nature of our nation’s infrastructure, and the massive financial liabilities related thereto. However, there appear to be no benchmarks for the fiscal sustainability of public works[2]. While there are articles showing increasing concern regarding Fiscal Sustainability, and increasing interest and use of asset management programs[3], there is as yet no widely available financial model or benchmark metric to enforce the discipline of considering assets as PERPETUAL obligations of the public works entity, and the funding required to replenish those assets.[4]
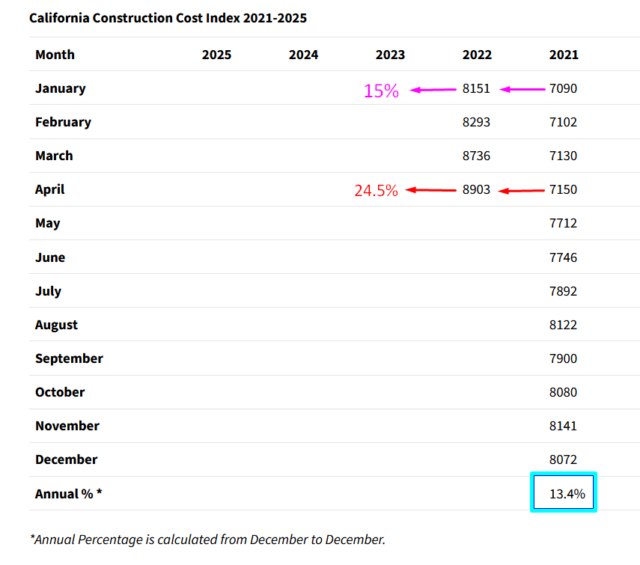
The recent surge in construction cost inflation due to the Pandemic, the Rape of Ukraine, and associated supply chain disruptions, coupled with the increase in interest rates, combine to make the assessment and funding of capital asset replenishment an urgent topic. Recently, districts have been quoted 4% interest on 30 year loans, plus 1.5% issuance costs for capital funding[5]. Those borrowing costs add over 73% to the cost of each asset, and competition for funding is surging. As interest rates rise from 80+ year lows, these extra costs are likely to increase for some years to come. Construction costs had their highest spike in 50 years. In California, construction costs increased 13.4% in 2021, and the recent year-to-year monthly increase was 24.5%. [chart below]
More than ever, public works institutions need to assess their capital replenishment needs, their rates and fees, and their funding programs because of these pressures. Yet the only AWWA benchmark related to capital funding is the System Renewal/Replacement Fund Allocation (%), which is based on the outdated original cost of assets, and does not set a normative standard for what SHOULD be allocated. What is needed is a tool that is both normative and comparative, showing the extent of the funding issues compared to need, and across utilities and regions.
Approach
To provide that fiscal sustainability metric, which we here call the Reserve Adequacy Rating, this paper builds upon established concepts previously expressed piecemeal, and integrates them into an assessment of how the capital reserves on hand compare to the amount needed to replenish the current asset inventory. The concept that Fiscal Sustainability is required for public works utilities has been with us since at least 2014.[6]
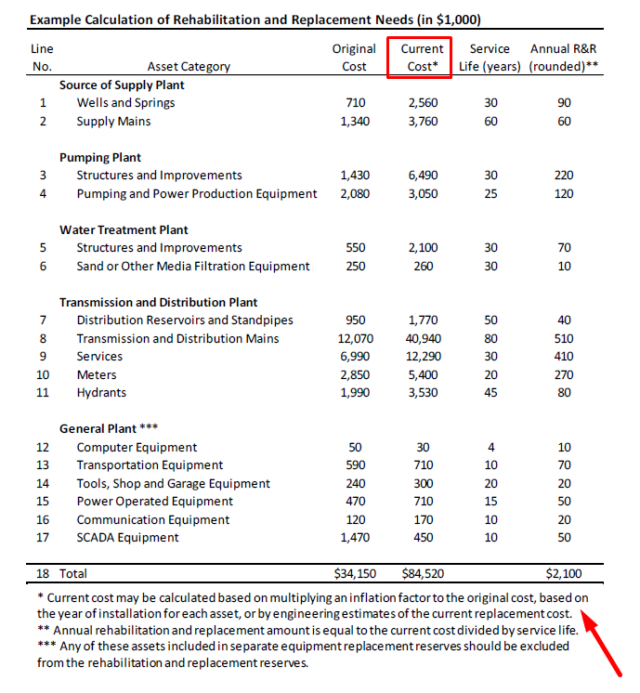
A second foundational concept is that capital reserves must be sized based on the age and current replacement cost of assets. This concept has been hinted at since at least 2010.[7] In 2018, the AWWA’s Cash Reserve Policy Guideline[8] included a table showing how annual rehabilitation and replacement amounts should be determined by the currrent asset replacement cost divided by the remaining service life [chart below], but it did not mesh this insight into an assessment of required reserves. Nonetheless, the concept is clear, you must pay today’s prices to replenish assets, and cannot use yesterday’s costs to size those investments.
Determining the current replacement cost of your utility’s Asset Inventory can be done in three ways. First, and most comprehensively, a total can be calculated in detail by an Asset Management Program which assesses the current replacement cost of each asset, the technologies now available for replacement, the options and costs to prolong the lives of current assets, and compares those to the payoff from replenishment (e.g. with more efficient equipment). We call this the Thorough Method. That is a laborious process, and one not often done annually, nor publicly disclosed. A second method, which we term the Detailed Method, is to use the Asset Inventory Spreadsheet utility staff forwards to the accountants annually, and use the original costs for each asset based on the date of service, together with the change in inflation indices since that date, to calculate the current replacement costs, and then sum the results. However, one cannot compare those costs easily across utilities as asset inventory information is not routinely published. The third, or Public Summary Method described herein, involves using publicly available financial statements to derive the average age and replacement costs of assets.
Determining how much of your asset inventory you need to replenish depends on their remaining lifetimes. Without relying upon access to detailed asset inventory spreadsheets, we can adopt and extend a concept used by the Fitch Rating Agency, among others, to calculate both the expected and remaining average asset lifetimes based on publicly available asset book values and current depreciation, and then can calculate what percentage of its useful life an asset inventory has already exhausted.[9] (Fitch calls this the Life Cycle Ratio, when the meaning is really “the degree to which assets have been exhausted”.) [excerpt below]
Thus, what you are about to read builds upon established industry and government concepts and techniques, extending them into a normative benchmark for required capital reserves. Determining the Reserve Adequacy Rating merely requires comparing the reserves on hand to the current replacement cost of assets already needing replacement. The calculations follow.
Methodology
Obtain the following numbers from the utility’s most recent annual financial report:
1. The as-of date of the financial statements
2. Original cost of capital assets[10]
3. Current book value of capital assets
4. Current annual depreciation
5. Operating margin (recurring)
6. Current Assets
7. Current Liabilities
To approximate the utility’s capital reserves, calculate:
Reserves = Net Current Assets = Current Assets – Current Liabilities[11]
Extending the Fitch approach, one can calculate the aggregate average age of a utility’s assets as follows, keeping in mind that the numbers will represent aggregate averages for all capital assets:
Asset Lifetime = Original Cost ÷ Annual Depreciation
Remaining Lifetime = Book Value ÷ Annual Depreciation
Thus, the current Age of those assets is:
Asset Age = Asset Lifetime – Remaining Life
Using that Asset Age, we can then backdate from the as-of financial statement date to determine the average original date of service of all assets:
Date of Service = As of Date, Fin’l Stmts – Asset Age
And now that we know the average age of the assets we can calculate the amount of inflation which has occurred since the original date of service. For most inflation indices[12] this results in a multiplier which is simply:
Inflation Factor = Inflation Index Now ÷ Inflation Index Date of Service
Finally, we can calculate the current replacement cost of the entire asset inventory as:
Replacement Cost = Original Cost × Inflation Factor
Now that we know the replacement cost and the age of the assets, we can determine what percentage of them are ‘aged out’, which is the ratio of their age and their original lifetime:
Life Cycle Ratio = Asset Age ÷ Asset Lifetime
And knowing what proportion of the assets are exhausted, we can calculate the reserves required today, should we have to replace those assets without borrowing:
Required Reserves = Replacement Cost × Life Cycle Ratio
Finally, we can assess the adequacy of reserves by calculating how today’s capital reserves compare to those required for today’s aged assets:
Reserve Adequacy Rating = Reserves ÷ Required Reserves
There will, of course be many unique situations across the nation-wide assortment of special districts, municipalities, joint powers authorities, and utilities that govern our public works infrastructure. The next section discusses some of the key assumptions used in this approach, data limitations, and extensions to this analysis to further improve its utility.
Limitations and Extensions
Below are situations and issues which affect the accuracy of the Public Summary Method described above, and which further discussion and research might refine going forward.
1. Determining Capital Reserves:
Not every utility has explicitly disclosed capital reserves on its balance sheet. Even those that show a figure for “Reserves” may include working capital, emergency, and/or debt repayment reserves in the total – thus overstating the amounts designated for capital asset replenishment. Further, a utility might have liabilities or practices which undermine the full use of reserve funds for capital. For example, cities transferring public works reserve funds for other purposes. For both ease of calculation and broader comparability across different accounting practices, We have chosen to use the Net of Current Assets minus Current Liabilities as a generous, but widely available, surrogate for Capital Reserves. This approach to calculating required reserves is likely a generous overstatement of the funds available for capital replenishment.
2. Defining Capital Assets:
For many organizations, Land is NOT included as a depreciable and replenishable capital asset, and we have honored that distinction here. Land is not depreciated, but it clearly has inflated in replacement cost. Given sea level rise and climate changes, it is possible that Land should be viewed as a capital asset needing eventual replacement, especially for public works near the water line. That of course would require a detailed asset condition assessment not obtainable easily from public financials statements for comparability. My exclusion of Land from this calculation is thus likely a generous understatement of the asset replenishment requirements for some utilities.
3. Improperly or Informally Valued Assets:
There are situations where assets are valued at zero, or were acquired for $1, or donated by real estate developers, and are not shown at their true cost, ever, on the balance sheet. Such under-valued assets will cause this method to understate both the depreciation on, and the replacement cost of, those assets. The approach described above for calculating required reserves is thus a generous understatement of the funds needed for capital replenishment when these situations are present.
4. Real-world Extended Asset Lifetimes:
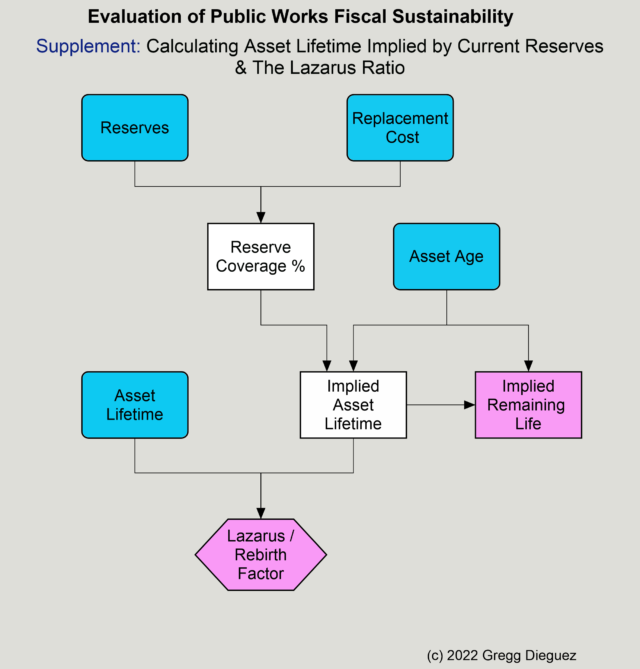
The duration or lifetime used for accounting depreciation is typically shorter than the extended asset lifetimes obtained by utilities in the field. Typically, stretching an asset’s useful life involves both additional risks and costs[13], but it is done frequently. There is no way a Public Summary Method using financial statements can approximate how much longer an asset inventory can be patched in service, nor the extra O&M costs attendant thereto. The approach described above for calculating required reserves likely overstates the funds needed for capital replenishment in the face of this practice. One can however, use the numbers above to calculate a Lazarus, or Rebirth, Factor reflecting: “How much longer would you have to stretch the lives of your assets in order for the reserves you have today to be adequate?”. We have done so in an example in item 6 below, with an accompanying flowchart.
5. Utilities With Shared Resources
It is common for smaller utilities to partner with others in funding and operating shared resources such as wastewater treatment plants, outfalls, reservoirs, etc. In these situations, the financials from the shared entity need to be allocated to the member utilities, and then the metrics for the target utility calculated based upon the inflated asset, liability, revenues and expenses. The allocation basis will be determined by the JPA agreement, typically either ownership % or usage %. Failure to allocate shared ownership assets will likely understate reserve requirements, as JPA’s are often not given custody of reserves, but reimbursed as needed.
6. Confirming Validity of These Estimates:
When we reviewed these metrics with a local utility, 10 months after their financials were published, they had gone through a new budget and assessment process. Their response when we told them they needed $75M in reserves (as opposed to the $23M in hand) was “Actually, it’s closer to $85M based on our latest assessment”. So one method of confirming the reasonableness of the Public Summary Method is to review the data with the utilities involved. Another way is to obtain the utility’s Asset Inventory spreadsheet, and calculate the Current Replacement Cost item by item (the Detailed Method), and compare that to the implied Replacement Cost described above. [We plan to do this for a few dozen utilities in our County.]
7. Amplifying The Message:
Some audiences may relate better to metrics that are not sterile ratios or percentages. Here are some alternative metrics derived from the above numbers which you may find useful. It is possible to calculate the “Implied lifetime of your assets that your current reserves are prepared to fund.”; call this the “Implied Remaining Life” of a utility’s assets. In a recent example, the utility had a Reserve Adequacy Ratio of 30.6%.[14] The Replacement Cost was $112M and the Reserves were $22.9M on assets with original average lives of 41.5 years. What useful life of those assets would justify having 20.4% of replacement costs currently reserved? The assets averaged 27.7 years old, so that reserve level implies a useful life of 135.5 years, which means a Remaining Lifetime of 107.9 years. Stakeholders can readily understand if the remaining life of their assets is close to that implied by their current reserves. The calculations required follow:
Reserve Coverage % = Reserves ÷ Replacement Cost
[$22.9M ÷ 112.1M = 20.4%]
Implied Asset Lifetime = Asset Age ÷ Reserve Coverage %
[27.7 years ÷ 20.4% = 135.5 years]
Implied Remaining Life = Implied Asset Lifetime – Asset Age
[135.5 – 27.7 = 107.9 years]
We can also calculate a “Lazarus Ratio” or “Rebirth Factor”, which is the number of times the assets would have to be magically reborn to justify the current level of reserves, as follows:
Lazarus Ratio = Implied Asset Lifetime ÷ Asset Lifetime
[135.5 ÷ 41.5 = 3.3x]
In my experience, these alternative metrics make the point about reserve deficiency very clearly.
8. Considering Ability to Recover from a Reserve Deficit:
As rating agencies well know, some utilities have more “financial horsepower” than others, and can handle larger amounts of debt and/or recover from downturns more readily. To assess ‘recovery time’ for deficient reserve levels, we can calculate a metric from the annual financial statements as follows:
Implied Cash Flow = Annual Depreciation + Operating Margin
Reserve Deficiency = Reserves Required – Current Reserves
Reserve Recovery Time = Reserve Deficiency ÷ Implied Cash Flow
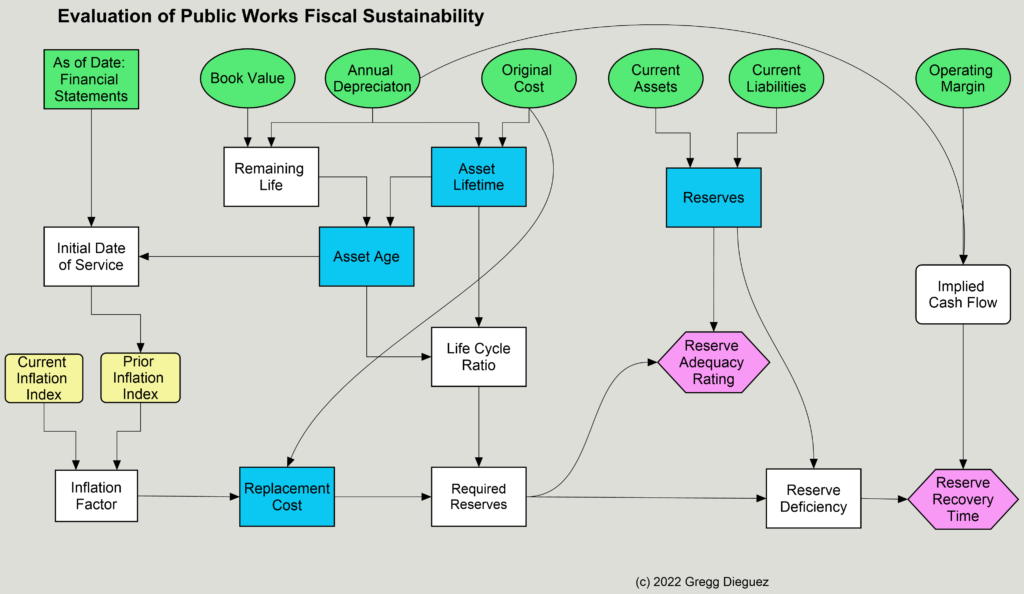
This is of course a flawed time estimate, because each year every asset’s replacement cost will increase by inflation, and most assets will become an additional year older – while a few will be replenished anew. Thus, if the calculated recovery time is, say 14 years, by the time 14 years have elapsed, the required reserves will likely be much higher and a deficit will persist. Nonetheless, utilities with lower Reserve Recovery Times are in better financial condition than those with longer ones, and this metric is an indication of that better fiscal resilience. As a conceptual aid to readers, we provide the following flowcharts depicting the derivation of the terms used above from the source financial statement data.
Implications
This methodology provides an estimate of the reserves required to replenish assets WITHOUT BORROWING. If a utility kept 100% of the reserves we calculate as required, it would likely never need to borrow for capital replenishment, and would avoid those extra expenses for its ratepayers. However, as one industry expert told me: “The industry is addicted to debt.” Thus, under current practices it is more likely that a utility will saddle future ratepayers with the extra costs of borrowing, in addition to the cost of the replacement assets. The causes of this ‘kick the can down the road’ funding ethos and the implications for long term costs and rates are several, and beyond the scope of this article, but a future paper can cover those topics and propose legal and governance remedies thereto. One benefit of this proposed Public Summary Method is that it will show the “unfunded capital needs” for each utility, which is a surrogate for the loan/bond principal required to close the immediate reserve funding gap – though that gap will widen in the future when borrowing costs ensue. Another benefit of this method is that it uses readily available public financial information to provide both normative and comparitive statistics for water, sewer, and other utilities.[15]
Recommendations & Next Steps
The iceberg of Public Works Capital Replenishment Costs yet to be disclosed is currently unknown. Likely, it will be shown to be our third major inter-generational justice issue after the Climate Crisis and Unfunded Pension Liabilities. We recommend that we revise accounting policies to handle asset cost inflation, likely by requiring supplemental notes to financial statements analogous to those now mandated for Unfunded Pension Liabilities. Further, after suitable refinement of this proposed technique by the AWWA and other professional analysts, we recommend that the AWWA begin publishing benchmarks on Reserve Adequacy in its Utility Benchmarking Manual. Hopefully fiscal sustainability metrics such as these will provide rate consultants and utility management firmer grounds for raising rates and connection-impact fees in order to ensure the reliable operation of the infrastructure.
As an exercise for the reader, you can pluck the half dozen numbers needed to calculate your utility’s fiscal sustainability metrics and send them – along with a link to your utility’s published financial statements[16] – to: fsbenchmark@gmail.com and we will add them, with the inflation factor, into our fiscal sustainability benchmark database and forward you a link to use when the database is online. Perhaps we can Crowdsource a Public Works Reserve Adequacy Benchmark Database, while awaiting industry action.
FOOTNOTES:
[**] Publication A version of this article has been submitted to the American Water Works Association (AWWA) under the title: “Assessing Public Works Fiscal Sustainability”. Any revisions to this approach following peer review will be updated herein.
[1] Use of Term “Utility”
We use the term “utility” to refer to the wide variety of water and wastewater districts and agencies, joint powers authorities, and “enterprise” portions of municipalities which provide water, sewer, stormwater, and other services to ratepayers. We further suggest the methodology outlined herein is applicable to any institution with long term capital assets which form the backbone infrastructure for its services.
[2] Literature on Fiscal Sustainability
Much of the literature on Fiscal Sustainability seems focused on debt and the ability to repay it, e.g. https://read.oecd-ilibrary.org/governance/long-term-fiscal-sustainability-analysis-benchmarks-forindependent-fiscal-institutions_budget-17-5jfjb4lcpkhh#page1 There is clear consideration of the inter-generational justice issues, for example p 135 “Fairness – the capacity of government to pay current obligations without shifting the cost to future generations”. However, there don’t appear to be metrics for the need to continually replenish underlying assets – merely the statement that such indicators should exist (e.g. C.02 pg. 139).
[3] Asset Management Best Practices: Keeping Ahead of the Curve; JournalAWWA, August, 2019.
[4] Fiscal Sustainability Metrics
This 2020 study surveyed available literature using “a flexible and comprehensive framework composed of 214 criteria distributed across nine categories that measure the degree of sustainability of public works” https://mdpi-res.com/d_attachment/sustainability/sustainability-12-06896/article_deploy/sustainability-12-06896.pdf?version=1598350253 It documents a wide variety of concerns, but we find no usable metrics.
[5] Recent Cost of Borrowing
Bartle Wells Associates, City of Pacifica Wastewater Rate Study: Page 3. https://www.cityofpacifica.org/documents/Sewer%20Rate%20Study%20Summary%20Memorandum.pdf
[6] Fiscal Sustainability Regulations
“On June 10, 2014, President Obama signed into law the Water Resources Reform and Development Act of 2014 (WRRDA). Among its provisions are amendments to the Federal Water Pollution Control Act (FWPCA), which includes the administration of the Clean Water State Revolving Fund (SRF) program. The WRRDA requirement to complete and implement a fiscal sustainability plan (FSP) will be a new condition of the SRF loan agreement.” https://www.michigan.gov/-/media/Project/Websites/egle/Documents/Funding/CWSRF/Financial-Sustainability-Plan-Guidance FAQ.pdf?rev=42e58cdebd1946a68a7d9ab751425c86
[7] AWWA Paper on Reserve Adequacy
How Can We Determine How Much Money to Set Aside for Financial Reserves? Opflow, 1 Sept. 2010 https://doi.org/10.1002/j.1551-8701.2010.tb02346.x “depreciation expense is an accounting concept to estimate the decline in useful life of an asset and doesn’t represent an asset’s current replacement cost. Therefore, an optimal balance may be an amount that’s greater than annual depreciation expense to approximate replacement cost.”
[8] AWWA Capital Reserves Guidelines
Awwa Rates & Charges Committee Whitepaper – Cash Reserve Policy Guidelines 2018, pg 8.
[9] Using Public Financial Data to Estimate Asset Ages
Fitch Ratings: U.S. Water and Sewer Rating Criteria, March 18, 2021; page 9
[10] Exclude Land from capital assets.
Refer to item 2 under Methodology for rationale.
[11] Use of Net Current Assets a surrogate for Reserves:
Refer to item 1 under Methodology for a discussion of why this approach is used for Reserves
[12] Inflation Index:
For our inflation calculations, we use the US Army Corps of Engineers CWCCIS Indices for plants (#13), buildings (#19) and permanent operating equipment (#20), which are free, as opposed to the Engineering News Record Construction Cost Index. Fortunately those three codes have identical index values, and go back to 1967, which has been sufficient duration for our purposes.
[13] Risk of Extending Asset Lives:
And that risk can turn into a million-dollar extra expense, as happened recently near here when a bus duct exploded due to water corrosion.
[14] Rounding Issues:
The numbers shown here are rounded, but full precision was used in the calculations.
[15] Extended Concerns About Capital Replenishment:
Perhaps for even condominium and homeowners associations, to consider the recent events related to unfunded maintenance in Florida…
[16] Need for Link to Utility Financial Statements: So that we can validate the data.
More From Gregg Dieguez ~ InPerspective
Mr. Dieguez is a native San Franciscan, semi-retired entrepreneur, and financial services/software executive. He is Vice Chair of the San Mateo Midcoast Community Council, but his opinions here are his own. In 2003 he co-founded MIT’s Clean Tech Program in NorCal, which became MIT’s largest alumni speaker program. He is involved with a number of the public works utilities in his district and has developed financial models thereof. His wife is still waiting for him to fix the fences.


