|
Getting your Trinity Audio player ready...
|
PRESS RELEASE. The whole Coastside has a population of 25,044, approximately 3% of the whole San Mateo County, yet the largest land mass. Breaking our district up would dilute our influence further.
Half Moon Bay had 12,834 in 2019.
MidCoast which includes El Granada (6,102), Moss Beach (3,604) and Montara (2,504), in 2019, had 12,210.
Please write in and let the County know what you think.
“Dear Redistricting Committee,
Please keep District 3 whole. Please do not split us up. The Coastside has special interests like Agriculture, Open Space, Tourism that the rest of the County does not, yet 100% of the County visits the Coastside. e need to stay whole so we work with “Our” Supervisor, as we have done with Supervisor, Don Horsley.”
Submit written testimony about the process or a specific map to districtlines@smcgov.org.
Oct. 11, 2021
Redwood City – Where would you draw the lines?
That’s the question the 2021 Supervisorial District Lines Advisory Commission is asking San Mateo County residents.
The 15-member volunteer commission is tasked with recommending a map or maps that balance the county’s 765,417 residents – based on the 2020 U.S. Census – among five supervisorial districts.
Every 10 years the County must account for population shifts and ensure that districts contain roughly equal population. This helps ensure all voters have an equal voice in electing the five members of the San Mateo County Board of Supervisors.
But the process is more than a numbers game. The map or maps are required by law to be based in part on public testimony the commission receives. This helps ensure communities with common interests are grouped together as much as practicable in a single district so those voters’ interests are not diluted.
Here’s a look at current population figures by district:
SAN MATEO COUNTY OFFICIAL 2020 POPULATION DATA |
|---|
| District | 1 | 2 | 3 | 4 | 5 | Total |
| Total Pop. | 151,639 | 162,113 | 154,804 | 149,515 | 147,346 | 765,417 |
| Deviation from Ideal | -1,444 | +9,030 | +1,721 | -3,568 | -5,737 | 14,767 |
| Each of the five districts must contain about 153,083 people |
Where would you draw the lines?
There are many ways to participate:
Submit written testimony about the process or a specific map to districtlines@smcgov.org.
Complete a Community of Interest survey, available online or for printing here.
Share your opinions / provide public comment using the hashtag #SmcDistrictLines on Twitter and Facebook.
Click here to see the calendar of workshops and public hearings at which you can speak about the process or a specific map.
Click here to watch videos of Supervisorial District Lines Advisory Commission meetings and watch tutorials on how to draw maps.
Click here for information on drawing and submitting maps.
The current deadline for the San Mateo County Board of Supervisors to adopt a final map is Dec. 15, 2021. The time to get involved is now!
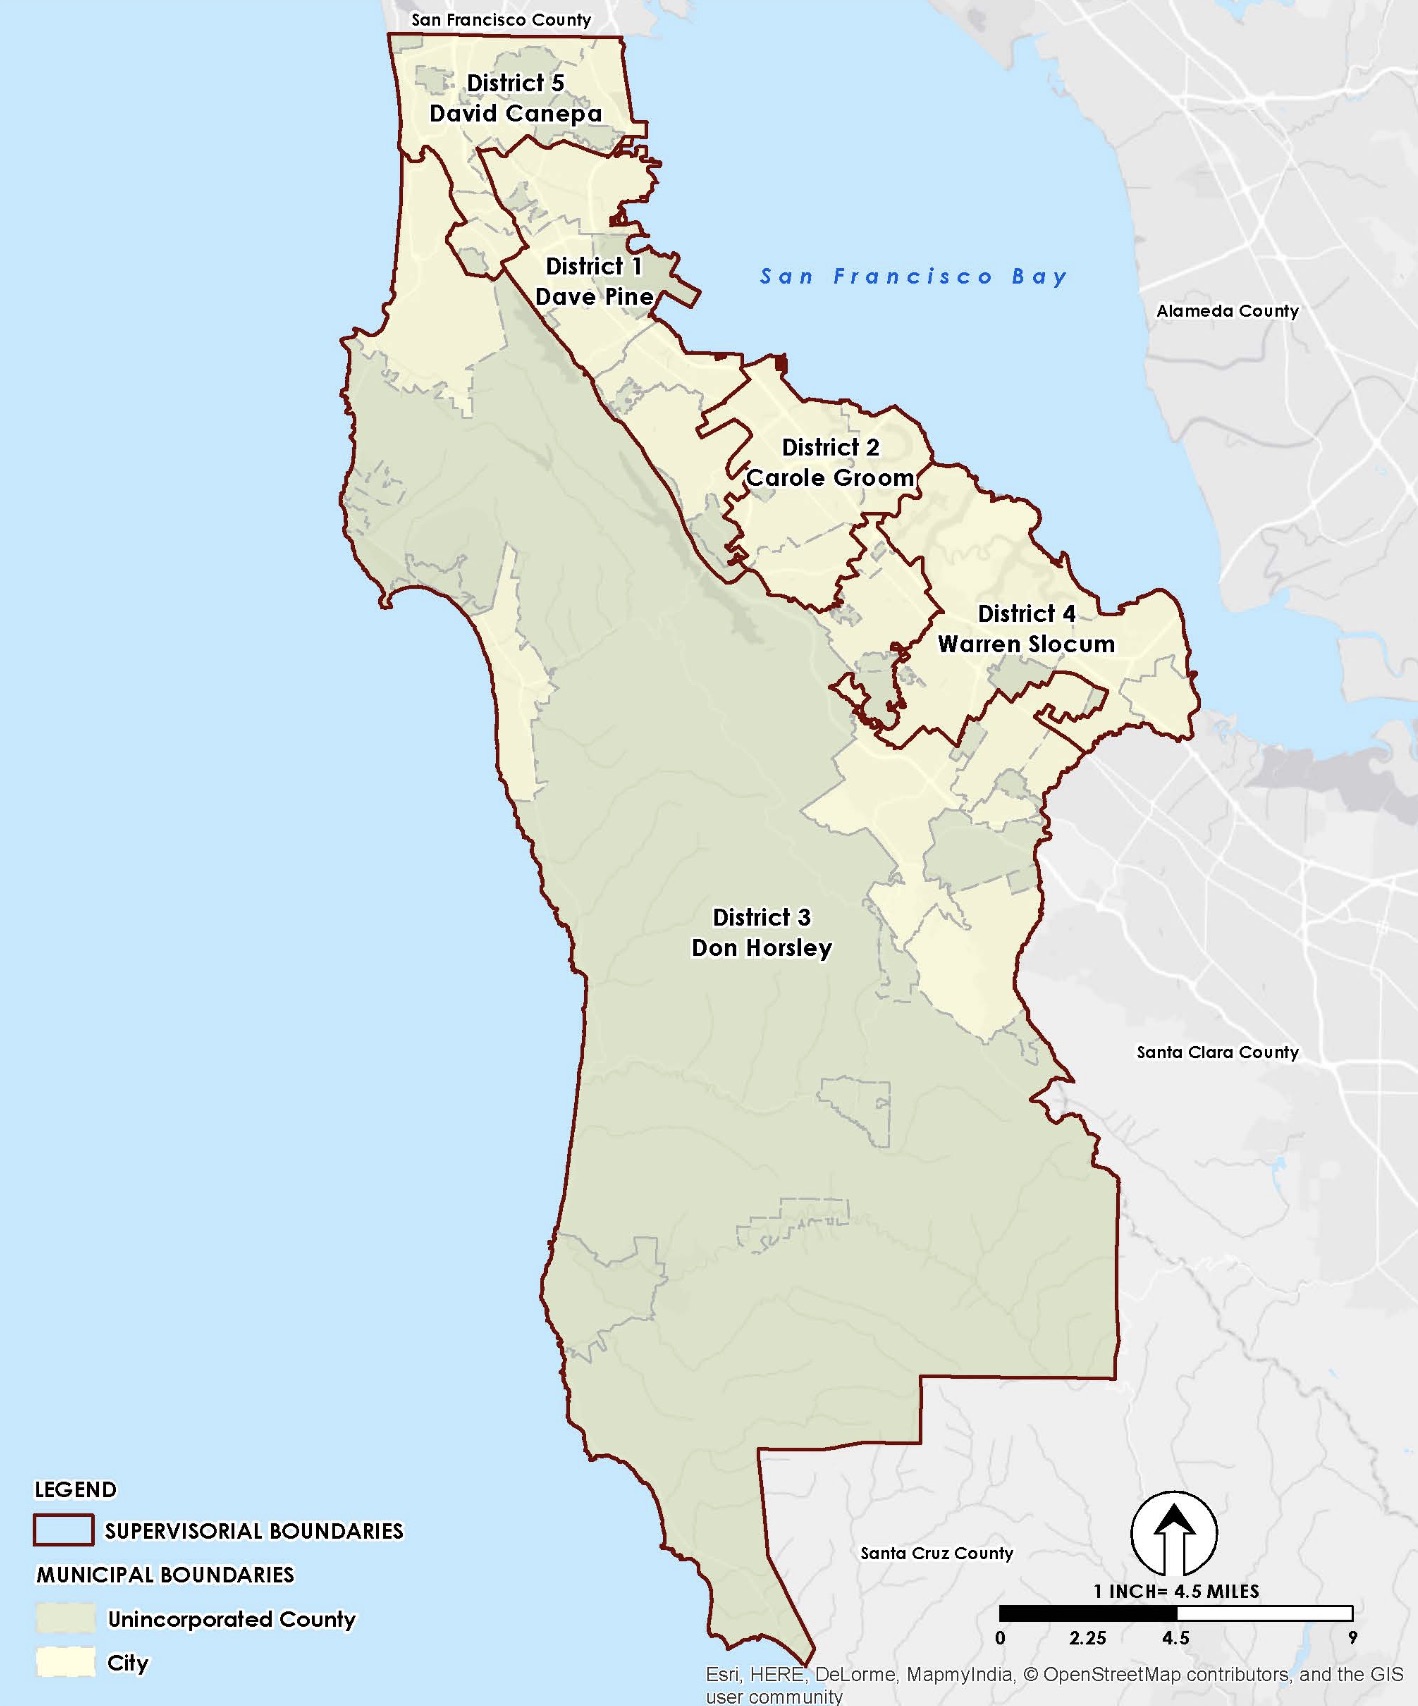
What do the existing Board of Supervisor districts look like?
Which district do you live in?
Go to our https://bos.smcgov.org/district-lookup tool and enter your address.
You can also zoom in and zoom out for a detailed look at the district boundaries.


