|
Getting your Trinity Audio player ready...
|
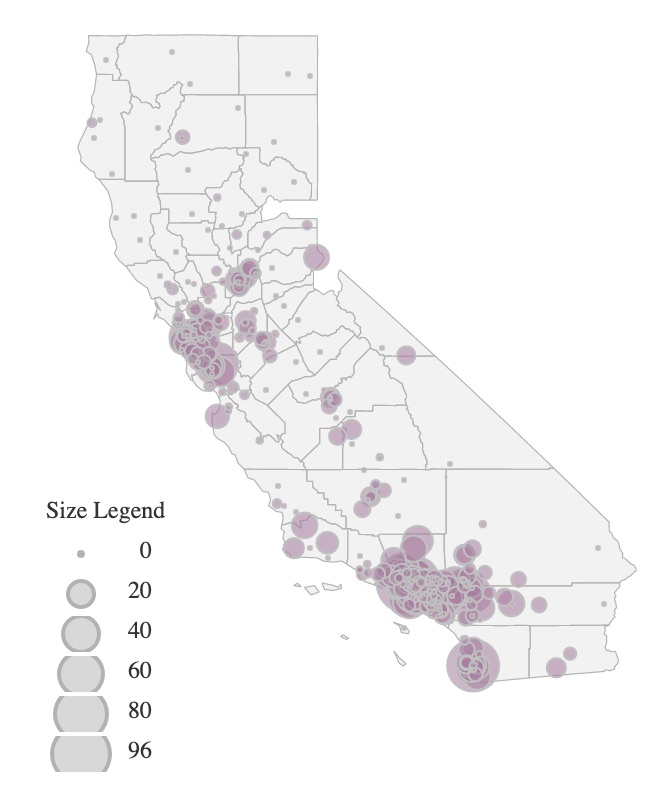
MAP and STATS.
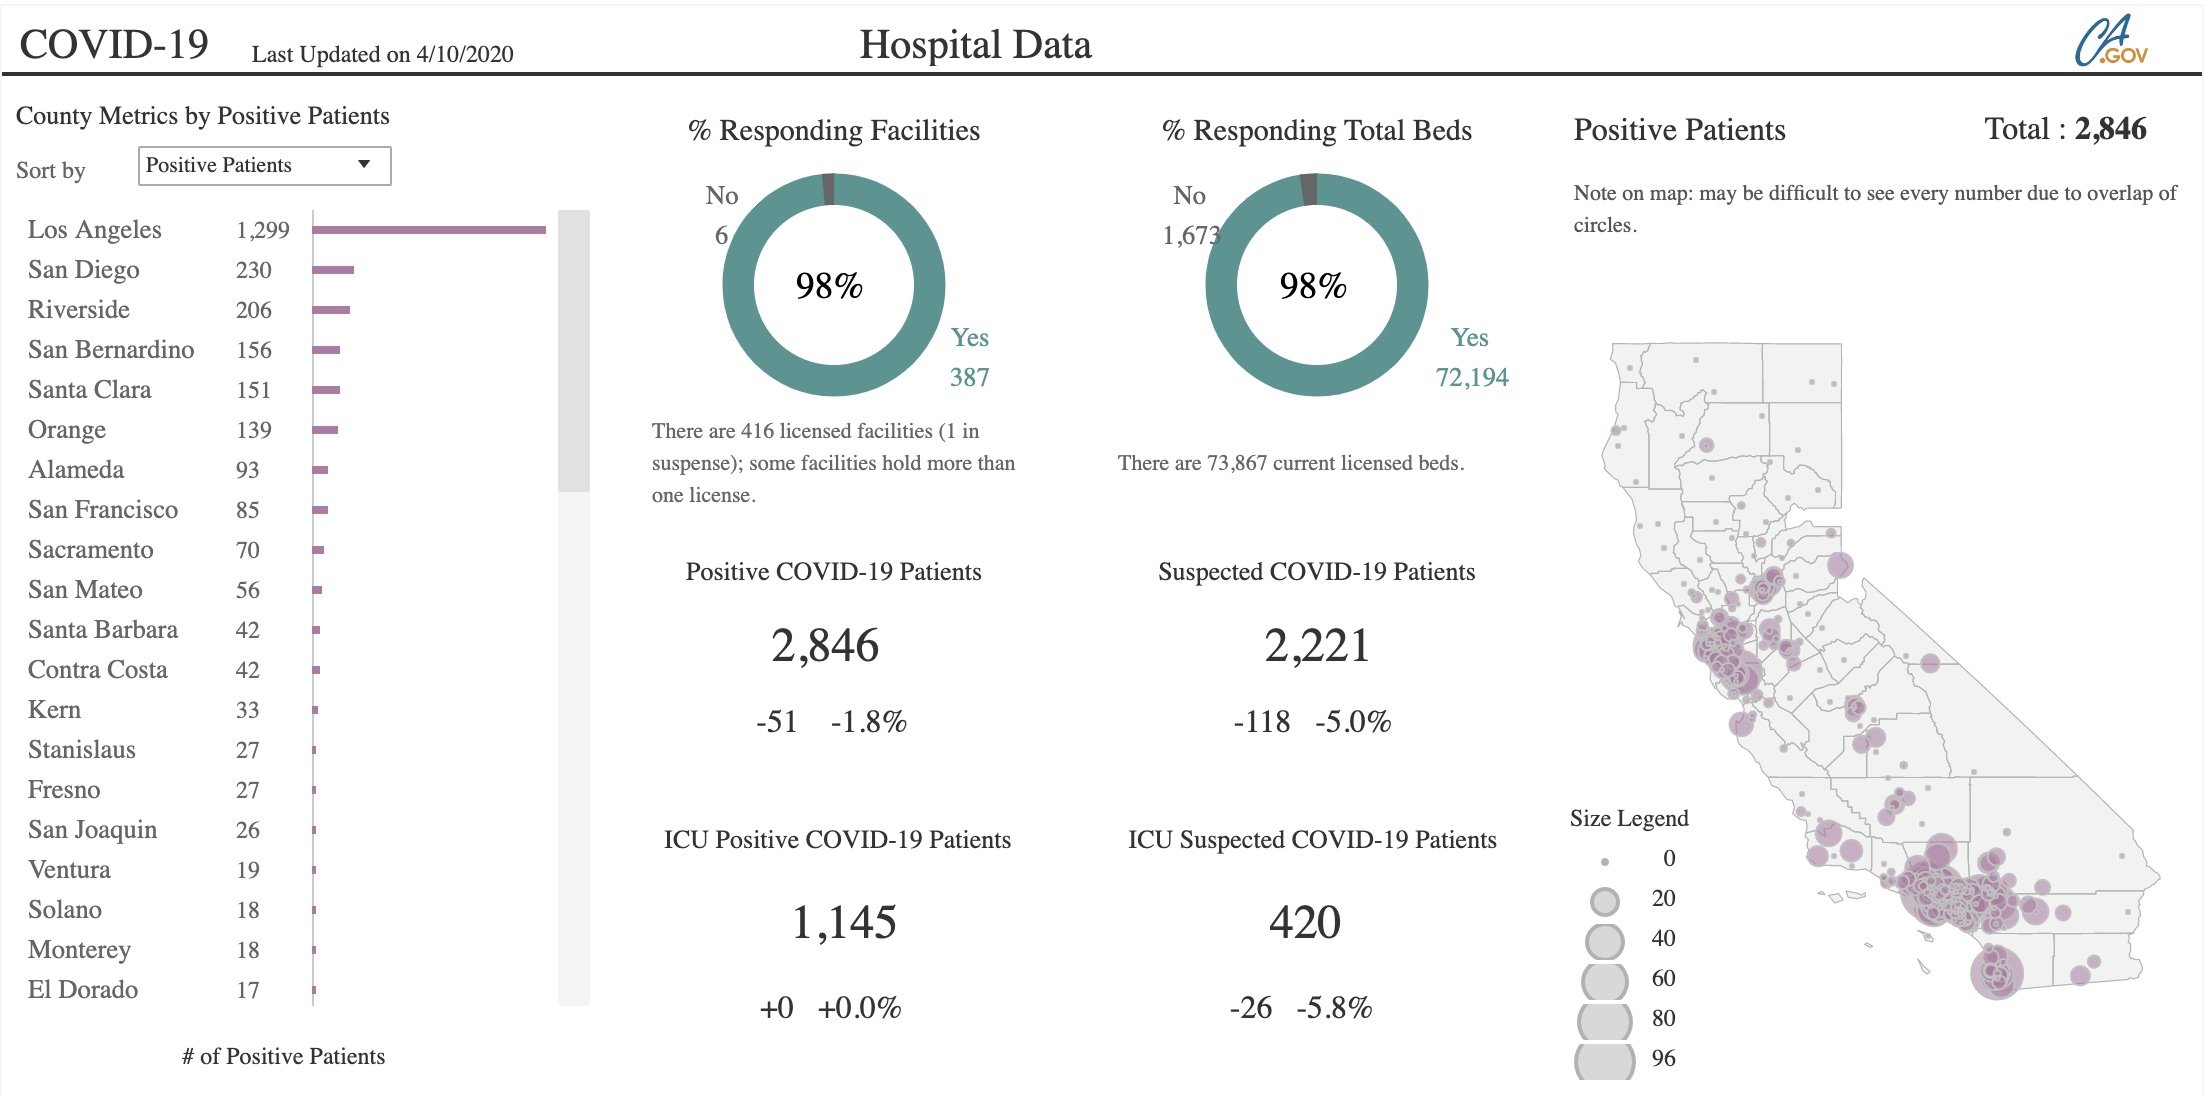
To the extent the actual data is available, there are a number of sites that show cumulative data over time, and various breakdowns (at the county level for California). The data gets better over time. And there are glitches as the recent jump from 13 to 21 deaths showed, when there was no update due to data problems for over a week. It wasn’t 8 more overnight, it was 8 more over the course of a week. But still, San Mateo and other counties are improving.
For hospitalization data, including covid ICU use (both confirmed and suspected) by county, see https://public.tableau.com/views/COVID-19PublicDashboard/Covid-19Hospitals?:embed=y&:display_count=no&:showVizHome=no ; that only shows state cumulative, but the underlying data are available on that site so you can do per-county cumulative. Some of the newspapers are doing similar things (LA times is one, and I think I saw it on the SF Chronicle site as well). ~ Dave Olsen, Midcoast Community Council


